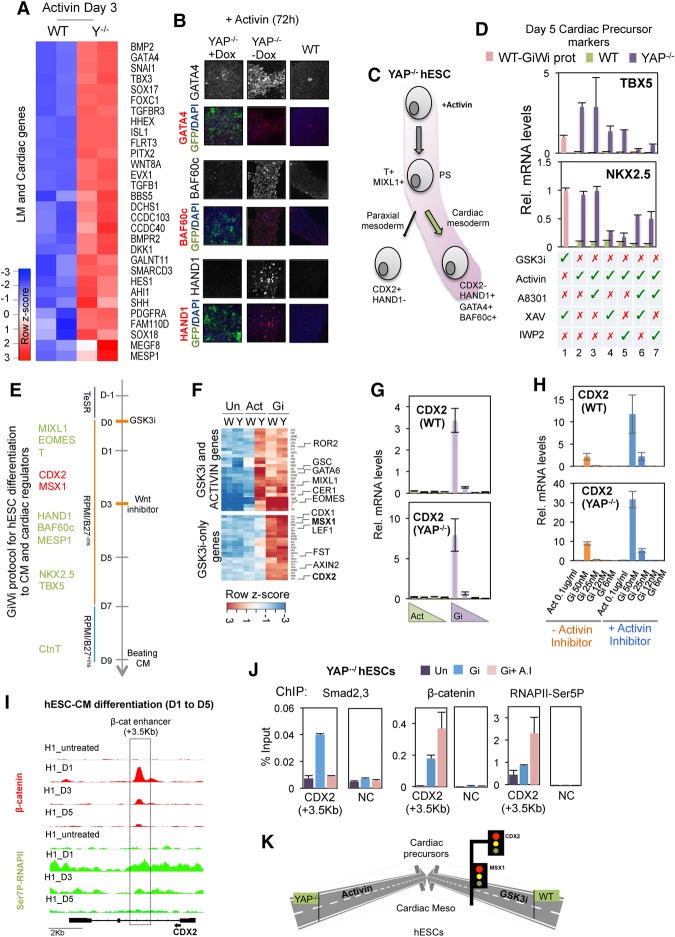
Figure 6.
Activin selectively promotes differentiation to cardiac mesoderm in YAP knockout hESCs. (A) Heat map plot showing the lateral mesoderm (LM) and early cardiac genes up-regulated in YAP knockout versus wild-type hESCs at day 3 following an initial 24 h of exposure to Activin. (B) Analysis of HAND1, GATA4, and BAF60c proteins by immunofluorescence in wild-type and PiggyYAP hESCs before and after doxycycline treatment. (C) Schematic showing the developmental pathway induced by Activin-treated YAP knockout cells. (D) Graphs showing the expression of cardiac precursor markers NKX2.5 and TBX5 in response to different treatments, as indicated below the graph; Activin or GSK3i treatments were added from day 0 to day 1, and XAV, IWP2, or A83-01 inhibitors were added from day 1 to day 2. Cells were collected at day 5 for analysis. For example, lanes 2 and 3 indicate 24 h of Activin treatment followed by A83-01 exposure for an additional 24 h (lane 3) or without further treatment (lane 2). (Lane 1) For comparison, wild-type hESCs were treated following the GiWi protocol, as indicated by the pink bar. Mean (SD). n = 3. (E) Scheme showing the GiWi protocol for hESC differentiation to cardiomyocytes (CM) (Lian et al. 2013). The main cardiac regulators that express sequentially are listed at the left. Proteins required for cardiomyocyte development are shown in green, and cardiac inhibitors are shown in red. (F) RNA-seq was performed in wild-type and YAP knockout cells treated with the specified cytokines for 30 h. Note that the GSK3i concentration used was equivalent to that used for the cardiomyocyte induction protocol (50 nM XV). The heat map shows mRNA levels of genes induced by Activin and GSK3i in wild-type and YAP knockout cells (top) and genes induced by only GSK3i treatment in wild-type and YAP knockout cells (bottom). (G) qPCR analysis shows mRNA levels of CDX2 in wild-type and YAP knockout hESCs after different concentrations of GSK3i (50–5 nM XV) and Activin (100–5 ng/mL) treatment for 24 h. The graph shows the average of two representative experiments of at least four independent replicates. Mean (SEM). n = 2. (H) qPCR analysis shows mRNA levels of CDX2 in wild-type and YAP knockout hESCs after treatment with GSK3i or Activin in the presence or absence of 1 µM Activin inhibitor A8301. The graphs show the average of two representative experiments of at least four independent replicates. Mean (SEM). n = 2. (I) Genome browser captures show β-catenin and CTD-Ser7P-RNAPII distribution on CDX2 gene in hESCs at day 0 and at days 1, 3, and 5 after initial differentiation following the GiWi protocol (see also Fig. 6E). (J) ChIP-qPCR analysis of β-catenin, Smad2,3, and RNAPII-Ser5P binding to the CDX2 enhancer (+3.5 kb) after treatment with GSK3i in the presence or absence of Activin inhibitor in YAP knockout hESCs. (NC) Negative control region. Mean (SEM). n = 2. (K) A schematic depiction to summarize the results of the figure.

