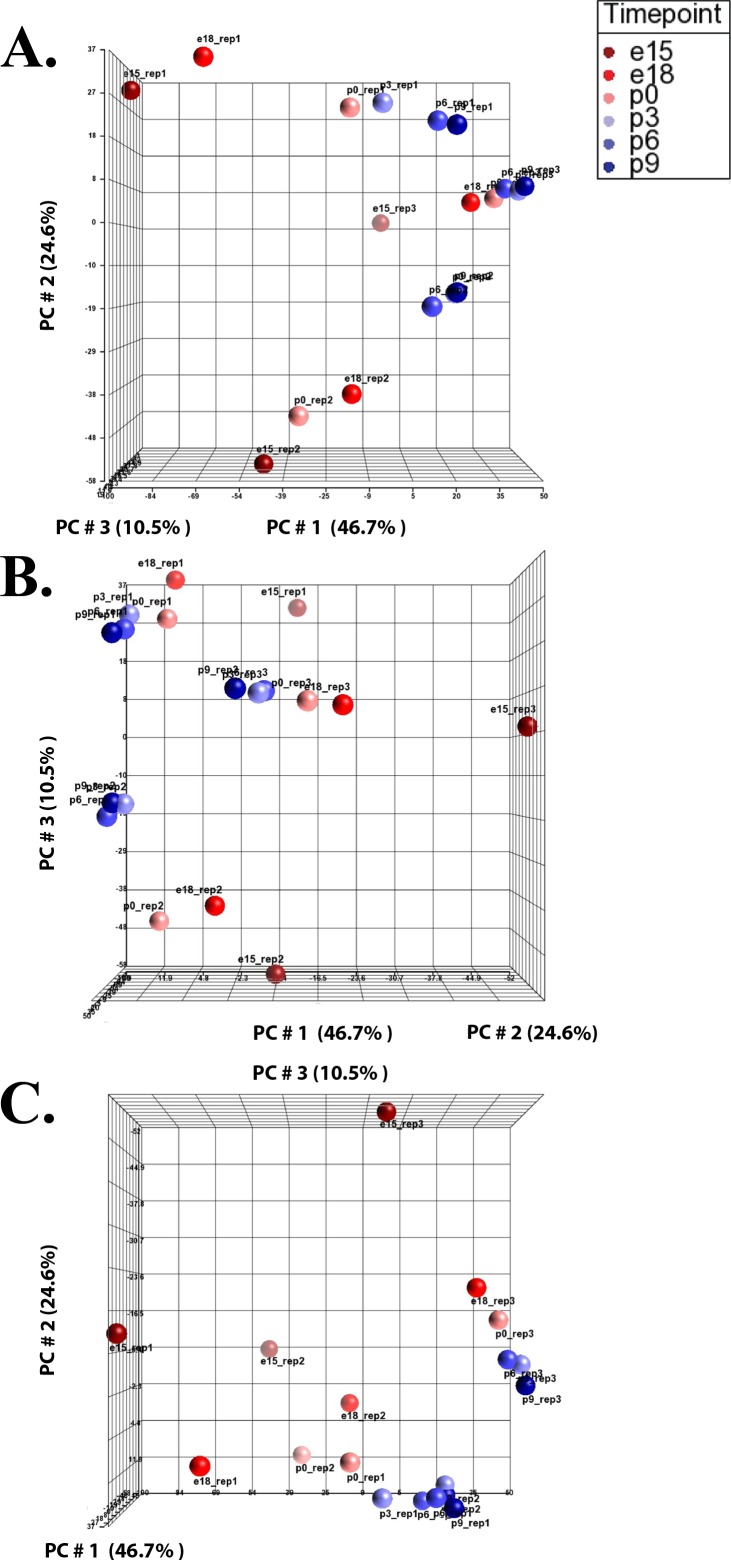
Figure 1.
Principal component analysis (PCA) illustrating direct comparisons among developmental time points. Partek Genomics Suite was used to create PCA plots using reporter ion intensities of each TMT dataset, independently. (A–C) Illustration of the PCA plot at different angles with x-, y-, and z-axes depicting the three largest components of variation in expression, expressed in percentage of the total, PC#1, PC#2, and PC#3, respectively.

