Fig. 6.
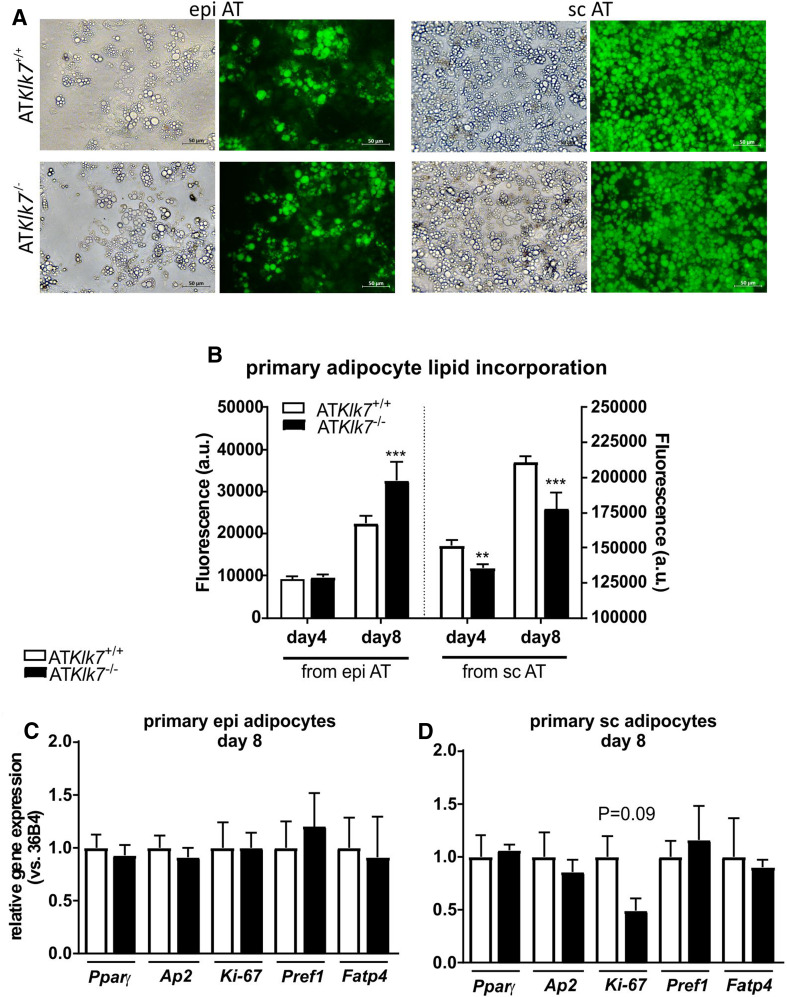
AT Klk7 deficiency in primary adipocytes. a Fluorescence microscopy of fully differentiated primary adipocytes from epi and sc AT. Lipid droplets were stained with the lipophilic AdipoRed reagent. Pictures were taken at day 8 after induction of differentiation. b Quantification of lipid accumulation using the AdipoRed assay in primary adipocytes from epi and sc AT (n = 5 wells). mRNA expression of marker genes of adipogenesis at day 8 after induction of differentiation was examined in primary cells of epi (c) and sc (d) AT by quantitative RT-PCR (n = 3). Data are represented as mean ± SEM and differences between genotypes were tested for statistical significance by a two-tailed Student’s t test; **P < 0.01, ***P < 0.001

