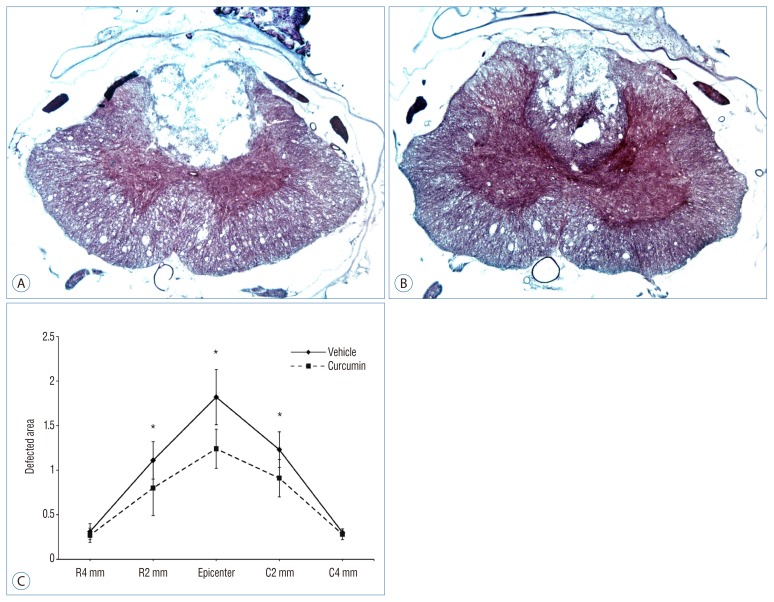
Fig. 4.
Measurements of the average area of lesion cavity at the injury epicenter and adjacent sections at an interval of 2 mm up to 4 mm rostrally and caudally. A : SCI-vehicle group (Hemotoxyline & Eosin, ×4). B : SCI-curcumin group (Hemotoxyline & Eosin, ×4). C : Histogram (C) showing the cavitation volume of the spinal cord lesion in both groups. *p<0.05, compared with the respective vehicle control. R : rostral, C : caudal, SCI : spinal cord injury.

