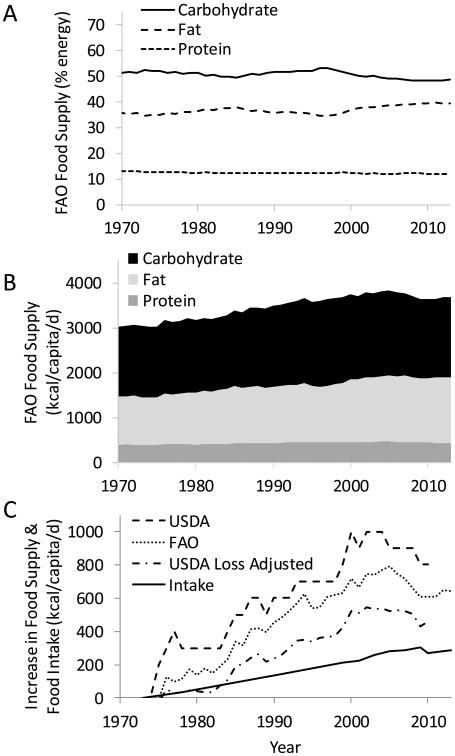
Figure 1.
A) Macronutrient proportions of the US food supply as determined by the United Nations Food and Agriculture (FAO) food balance sheets (http://www.fao.org/faostat/en/#data/FBS). B) Total per capita energy content and contributions of carbohydrate, fat, and protein in the US food supply as determined by the FAO. C) Incremental increases in food energy supply since 1973 calculated using data from the FAO, United States Department of Agriculture (USDA) food availability (https://www.ers.usda.gov/data-products/food-availability-per-capita-data-system/food-availability-documentation/), and USDA loss-adjusted food availability (https://www.ers.usda.gov/data-products/food-availability-per-capita-data-system/loss-adjusted-food-availability-documentation/), along with calculated energy intake changes corresponding to the US population weight gain (12).

