
Figure 6. MIF-expressing PAN02 exosomes induce liver pre-metastatic niche formation.
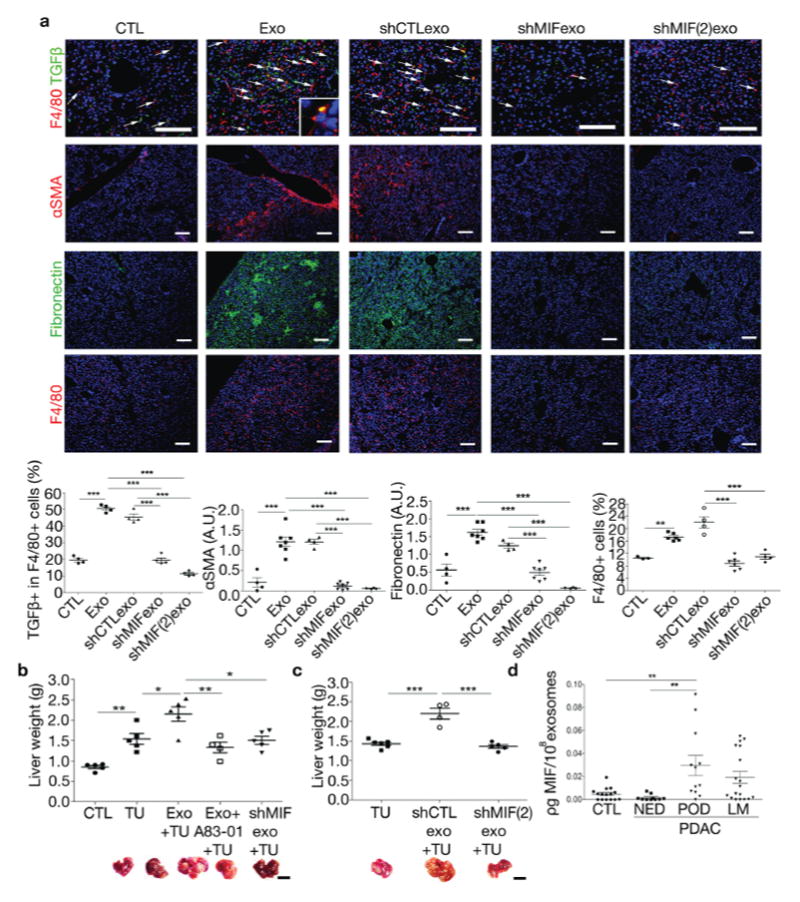
(a) Representative images and quantification of pre-metastatic niche markers in livers educated with PAN02 exosomes (Exo), PAN02shCTL exosomes (shCTLexo), PAN02shMIF exosomes (shMIFexo and shMIF(2)exo) or PBS control (CTL). Immunofluorescence analysis shows frequency of TGFβ-expressing F4/80+ cells, αSMA and FN expression as well as F4/80+ cell frequency. Inset shows TGFβ+/F4/80+ cell; n = 3 (CTL F4/80), n = 4 (CTL TGFβ, αSMA, FN; Exo TGFβ; all shCTL; shMIF TGFβ; all shMIF(2), n = 6 (Exo F4/80; shMIF F4/80), n = 7 (Exo αSMA, FN; shMIF αSMA, FN) mice pooled from two experiments. ***P < 0.001, **P < 0.001 by ANOVA. Scale bars, 100μm. (b) Evaluation of liver metastasis by liver weight (grams) in tumor-free mice (CTL), mice injected intra-splenically with PAN02 cells either pre-educated with PBS (TU), with PAN02 exosomes (Exo+TU), with PAN02 exosomes in combination with A83-01 (Exo+A83-01+TU), or with PAN02shMIF exosomes (shMIFexo+TU); n = 4 (Exo+A83-01+TU), n = 5 (CTL, TU, Exo+TU, and shMIFexo+TU) mice pooled from two experiments. **P < 0.01, *P < 0.05 by ANOVA. Scale bar, 1cm. (c) Evaluation of liver metastasis in mice injected intra-splenically with PAN02 cells either pre-educated with PBS (TU), with exosomes isolated from PAN02 cells infected with control shRNA (shCTLexo+TU) or shMIF(2) (shMIF(2)exo+TU) lentiviral vectors; n = 4 (shCTLexo+TU), n = 5 (shMIF(2)exo+TU) and n = 6 (TU) mice from one experiment. ***P < 0.01 by ANOVA. Scale bar, 1cm. (d) Enzyme-linked immune assay (ELISA) reveals increased levels of MIF (picogram per 108 exosomes) in exosomes isolated from patients with pancreatic ductal adenocarcinoma (PDAC) with progression of disease post-diagnosis (POD) compared to PDAC patients with no evidence of disease 5 years post-diagnosis (NED) and to healthy controls (CTL), but not PDAC patients with liver metastasis (LM); n = 10 (NED), n = 12 (POD), n = 15 (CTL) and n = 18 (LM) patients. All patient samples were analyzed once as part of three independent ELISA assays. **P < 0.01 by ANOVA. All data are represented as mean±s.e.m