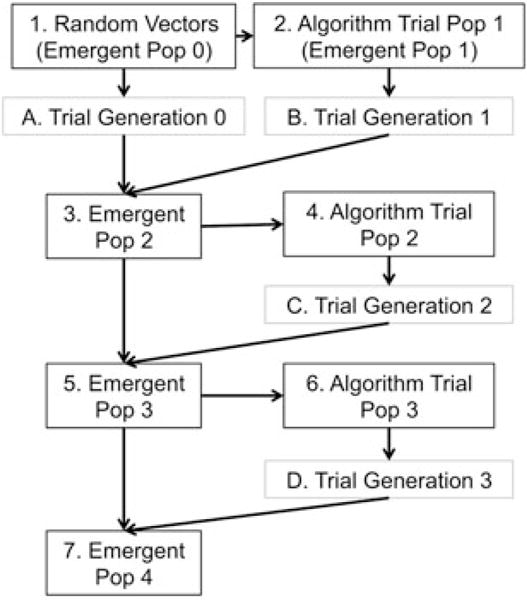
Figure 1.

DE algorithm flow chart, with black boxes representing DE algorithm steps and grey boxes representing experimental steps. The DE algorithm produces a population in gen 0 that randomly spans the parameter space, and a trial population (gen 1) that is based on mutation of gen 0. These are both experimentally tested by the user and the live cell recovery results are input into the DE algorithm, producing an emergent population which is further mutated and iterated in subsequent experiments. As the algorithm converges, an optimum solution can be identified
