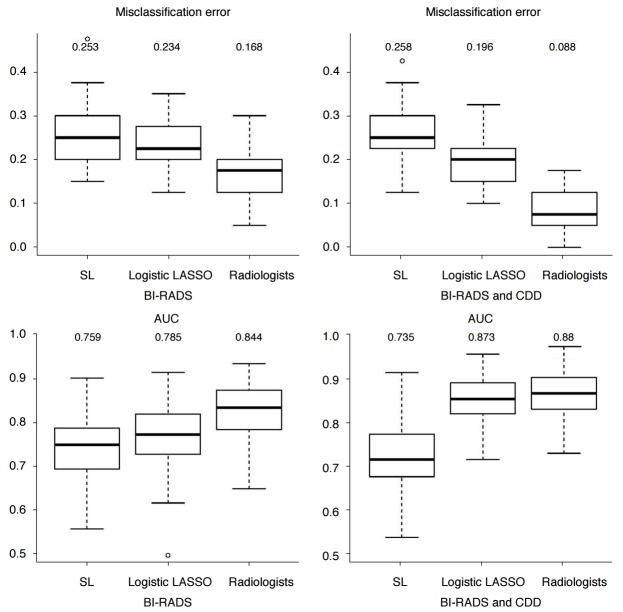
Fig. 1. Box plots of the test misclassification errors and AUCs.
The first column used only the BI-RADS descriptors, and the second column used CDD as well. All numbers in the box plots are the corresponding mean values. AUC, area under curve; BI-RADS, Breast Imaging Reporting and Data System; CDD, clinical and demographic data; LASSO, least absolute shrinkage and selection operator; SL, stepwise logistic.

