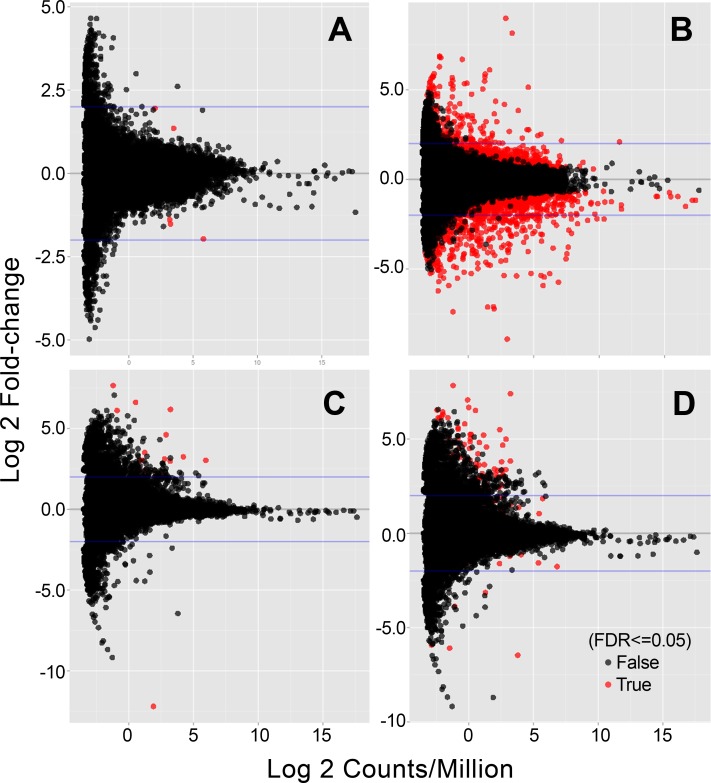
Fig 1. MA plots for genes that were altered in lenses obtained from Cryaa-R49C or Cryab-R120G mutant knock-in mice as compared with age-matched WT mice.
(A) 2-day-old Cryaa-R49C-het, (B) 2-day-old Cryaa-R49C-homo, (C) 14-day-old Cryab-R120G-het, and (D) 14-day-old Cryab-R120G-homo mice. The x-axis indicates the average expression over all samples in the Cryaa (or Cryab) lenses. The y-axis represents the log 2-fold change of normalized counts between the mutant and WT samples.

