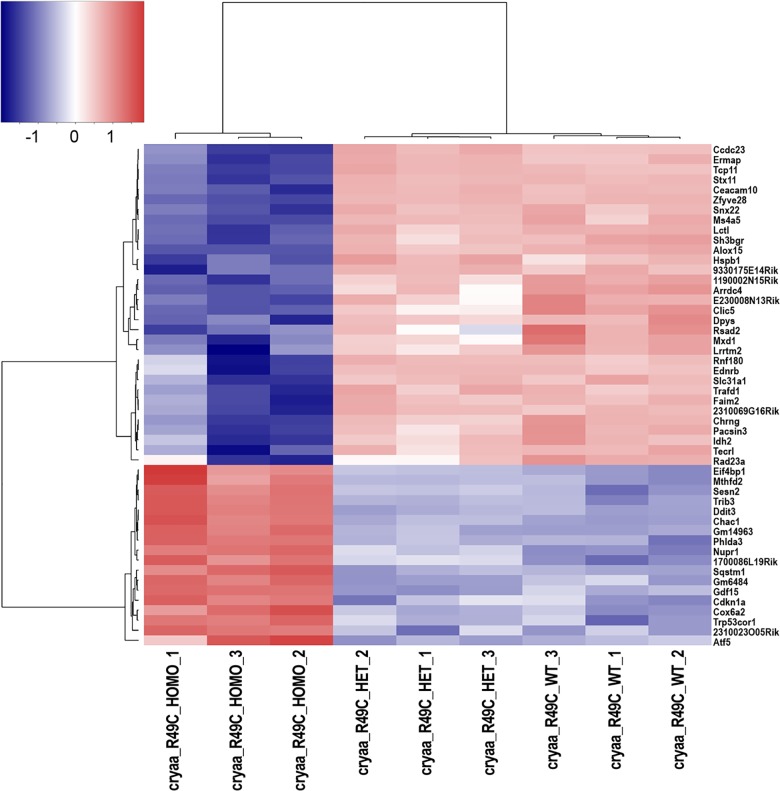
Fig 2. Heat map of genes with altered expression in Cryaa-R49C knock-in mutant lenses as displayed by the R package heatmap3 [31].
In order to illustrate relative log 2 fold-changes across samples, the values displayed per gene represent log 2 transformed counts-per-million with a prior count of 2, which were then rescaled to a mean of 0 with a standard deviation of 1. The genes and samples were then re-organized by hierarchical clustering to illustrate the similarity of expression changes within and across genotypes.

