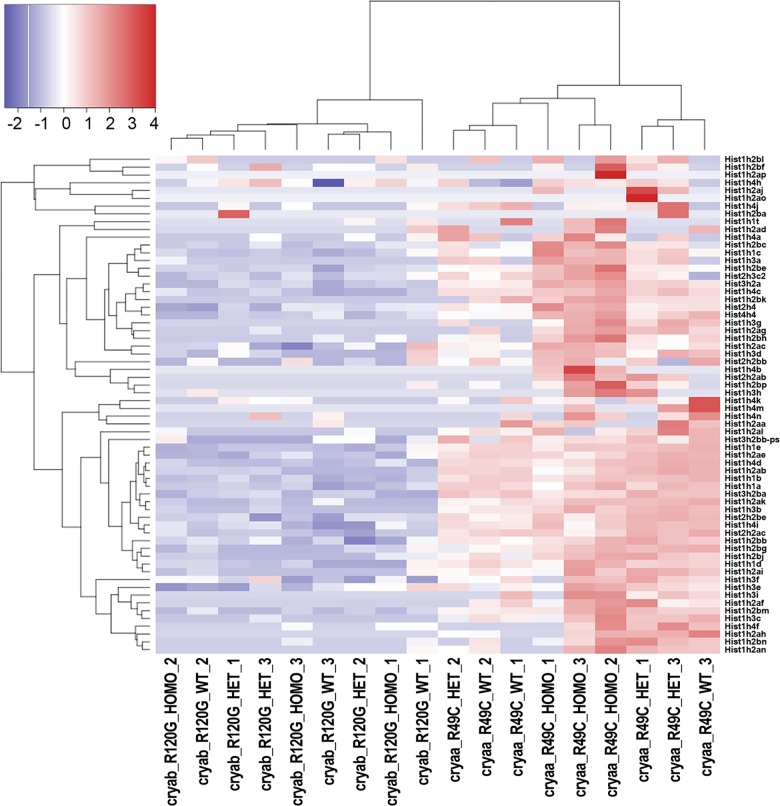
Fig 3. The heat map for change in histone genes in Cryaa-R49C and Cryab-R120G knock-in mutant lenses as displayed by the R package heatmap3 [31].
In order to illustrate relative log 2 fold-changes across samples, the values displayed per gene represent log 2 transformed counts-per-million with a prior count of 2, which were then rescaled to a mean of 0 with a standard deviation of 1. The genes and samples were then re-organized by hierarchical clustering to illustrate the similarity of expression changes within and across genotypes. In one of the WT samples, the analysis of histone gene expression appeared more like that of the Cryaa-R49C-het sample, indicating that variability in the expression of the histone genes can occur even within the same genotype. This outlier was not the result of a sample mix-up, because the non-histone genes exhibited the same fold change and direction of change as the three genotypes.

