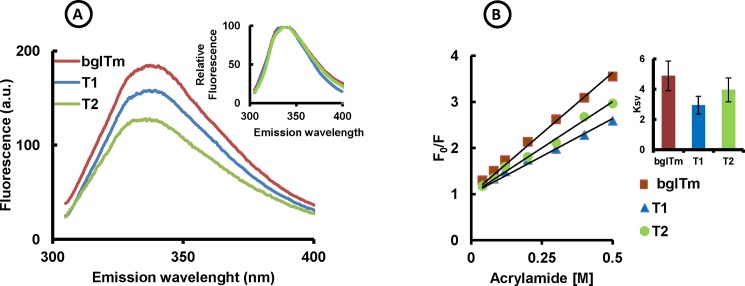
Fig 3. Fluorescence spectra and acrylamide quenching of the wild-type and mutant bglTm proteins.
(A) Intrinsic fluorescence spectra. Red, wild-type bglTm; blue, T1 mutant; green, T2 mutant. The samples were excited at 295 nm. Insert: relative fluorescence spectra. (B) Effect of acrylamide on bglTm fluorescence. Red, wild-type bglTm; blue, T1 mutant; green, T2 mutant. F, fluorescence in the presence of acrylamide; F0, fluorescence in the absence of acrylamide. Fluorescence readings were measured at the wavelength (λmax) with the highest emission in the absence of acrylamide. Insert: Ksv parameters with respective deviations for wild-type and mutant bglTm proteins.

