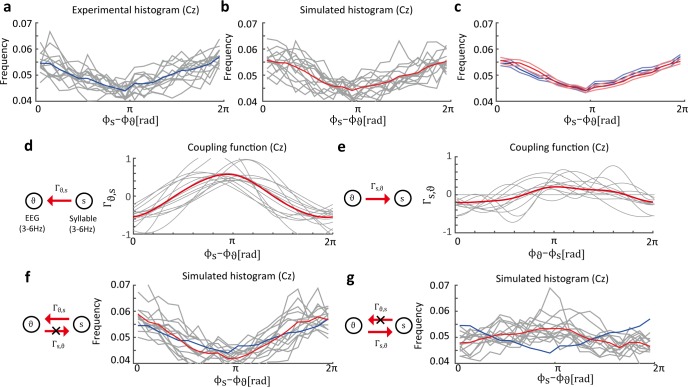
Fig 5. Estimated distribution of phase difference between EEG data and syllable envelope.
(a) Experimental histogram of phase difference between the theta oscillation on the Cz electrode and the syllabic rhythm (the histograms show phase locking). The gray lines represent histograms of individual participants and the blue line represents the histogram averaged over all participants. (b) Histograms obtained from the simulated data in the estimated phase oscillator model. The averaged histogram is similar to the experimental histogram. The gray lines represent the phase difference histograms of individual participants. The red line represents the average of the simulated histograms. (c) Blue lines represent the averaged experimental histogram and the standard error of mean (SEM). Red lines represent the averaged simulated histograms and the SEM. (d) Estimated coupling functions Γθ,s from syllabic rhythm to theta oscillation. The gray and red lines represent the results of individual participants and the average results of all participants, respectively. (e) Estimated coupling functions Γs,θ are considerably smaller than the opposite directional coupling functions. (f) Simulated histograms where the coupling functions Γs,θ are removed. The effect on the original phase-locking state was negligible. (g) Histograms where Γθ,s were removed are nearly flat.

