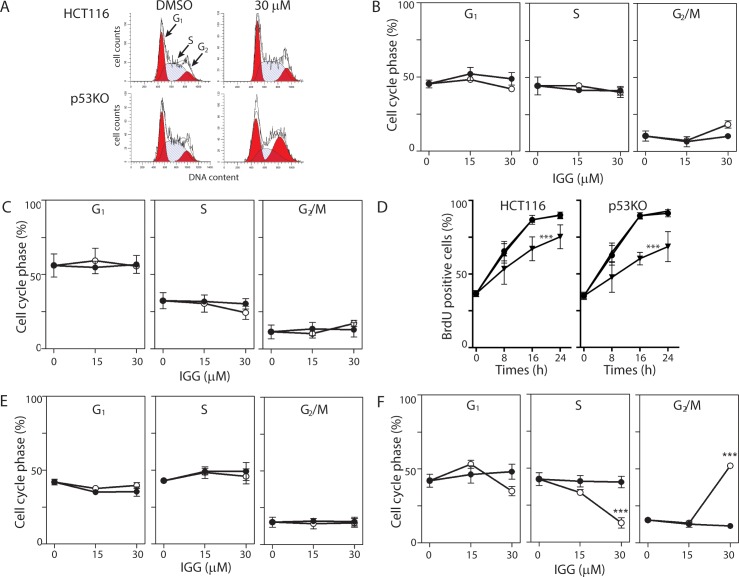
Fig 1. Similar effects on cell growth but differences in cell cycle distribution in IGG treated HCT116 and p53KO cells.
HCT116 and p53KO cells were incubated in 15 μM IGG, 30 μM IGG or vehicle control for either 8 or 24 hours. One-parameter flow cytometric analysis of PI stained cells was used to determine cell cycle distributions (G1, S and G2/M) based on DNA content, using Modfit 4.1 cell cycle analysis software. (A) Representative histograms are presented for samples collected 24 hours following exposure to 30 μM IGG and its vehicle control. (B and C) The compiled cell cycle results from similar analysis of HCT116 cells collected at 8 (B) and 24 (C) hours following treatment with the indicated concentration of IGG (open symbols) and the corresponding vehicle controls (closed symbols). (D) HCT116 and p53KO (left and right panels, respectively) were incubated in growth medium alone (circles), DMSO (triangles) or IGG (inverted triangles) along with BrdU for the indicated period. The proportion of cells incorporating BrdU at each time point was estimated by flow cytometry. (E and F) p53KO cells were incubated in IGG for either 8 (D) or 24 hours (E) at the indicated concentration (open symbols) or with an equivalent volume of DMSO (closed symbols). Each value in B through F represents the mean (+/- SEM) determined from a minimum of 3 independent experiments. *** indicates that the value is significant different (P<0.001) from controls (DMSO and no drug) by one way ANOVA followed by Tukey multiple comparisons test.

