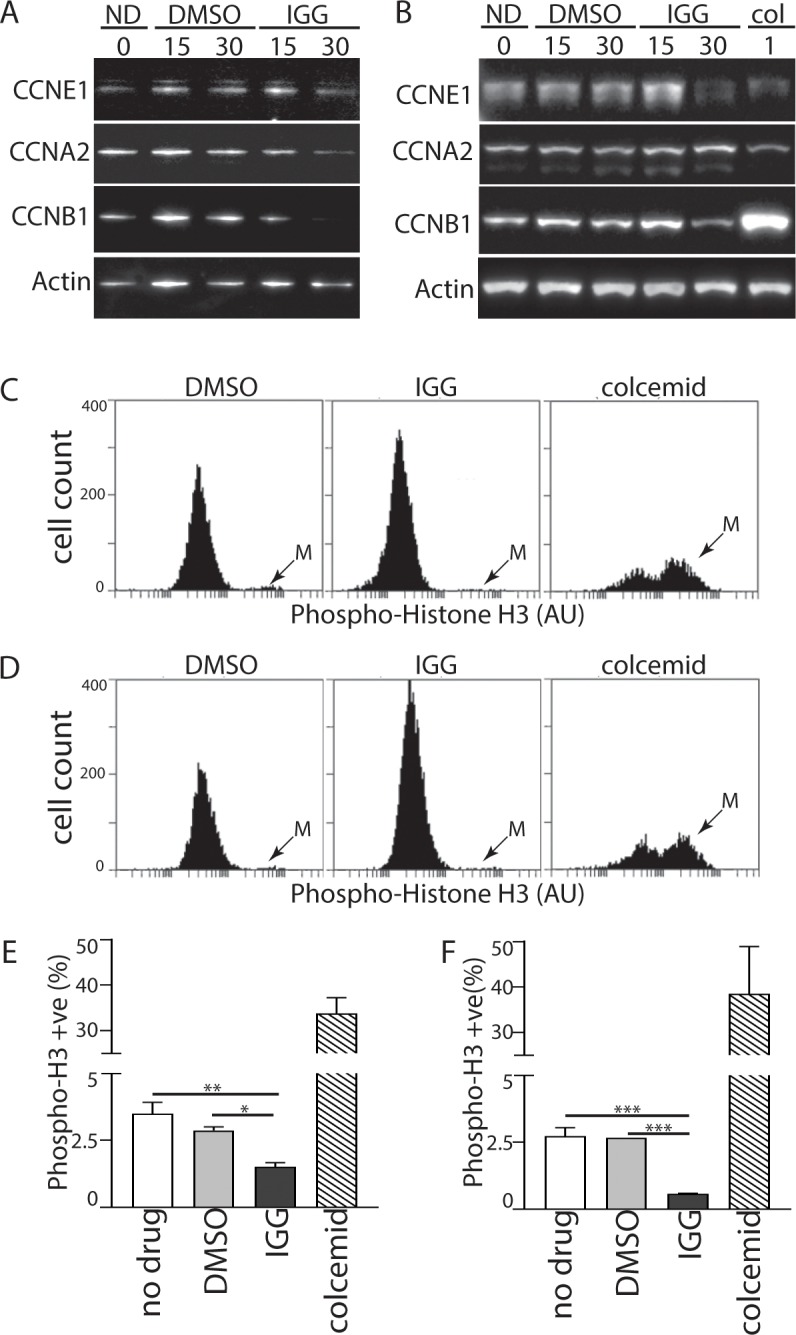
Fig 2. Markers of M phase are decreased in response to IGG.

(A) HCT116 cells were incubated in IGG for 24 hours. Protein lysates were collected and analyzed by immunoblot using antibodies raised against the indicated proteins. (B) p53 KO cells were treated as described in (A) except that colcemid, a microtubule-depolymerizing agent, was included in lane 6. HCT116 (C) and p53KO (D) cells were exposed to DMSO, IGG or colcemid for 24 hours and the M phase-specific phosphorylation of histone H3 was detected using a phosphospecific antibody coupled with flow cytometry. ‘M’ denotes the mitotic population. The proportion of phospho-H3 positive cells was determined from 3 independent experiments (E and F). *, ** and *** denote that the values were significantly different (P 0.05, 0.01, 0.001, respectively) by one way ANOVA followed by a Tukey multiple comparisons test. Statistical analysis of colcemid, the positive control, was not included for clarity.
