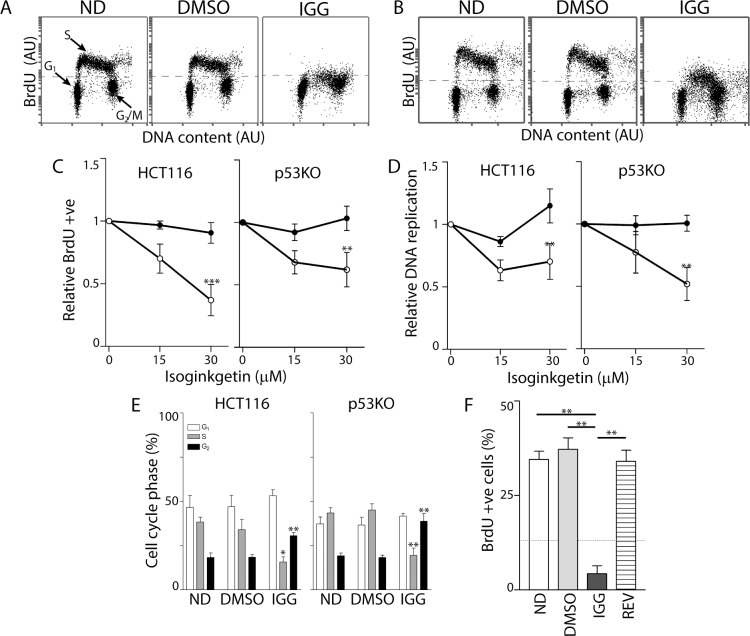
Fig 3. IGG induces S phase arrest in HCT116 and p53KO cells.
Two-parameter flow cytometry analysis of BrdU incorporation and DNA content was performed following a 24-hour exposure of HCT116 (A) and p53 KO (B) cells to 30 μM IGG. (C) The proportion of BrdU positive cells was determined and expressed relative to untreated controls. (D) Relative replication is an estimate of the efficiency of DNA replication in the BrdU positive population of cells. (E) Cell cycle distribution of no drug- (ND), vehicle control- (DMSO) and 30 IGG-treated cells was estimated from dot plots like those presented in A and B. (F) HCT116 cells were exposed to either DMSO for 48 hours (DMSO) or IGG for 24 hours (dashed line) followed by either an additional 24 hours in IGG or fresh medium with DMSO (REV). Data obtained from multiple experiments were expressed as the mean percentage of BrdU positive cells. Each value in C-F represents the mean (+/- SEM) determined from 4, 4, 6 and 3 independent experiments, respectively. In C and D, ** indicates that the values were significantly different (P < 0.01) by two way ANOVA followed by Bonferroni post hoc tests. In E and F, * and ** denote that the value was significantly different (P < 0.05 or P< 0.01) by one-way ANOVA followed by Tukey multiple comparisons test.

