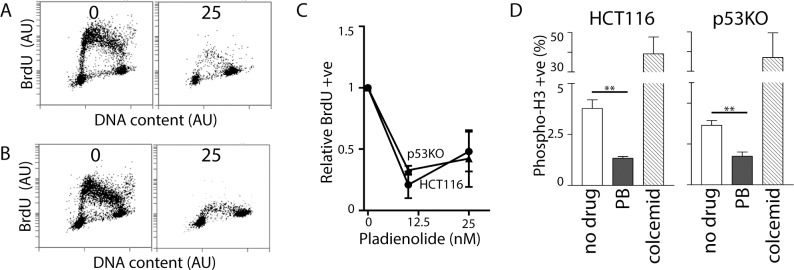
Fig 5. Effects of PB on S and M phases of the cell cycle.
HCT116 and p53KO cells were exposed to either 0 or 25 nM PB for 24 hours. HCT116 (A) and p53KO cells (B) were BrdU labelled for 1 hour prior to collection. BrdU incorporation was then assessed by two-parameter flow cytometric analysis. (C) The proportion of cells incorporating BrdU was determined and this is expressed relative to untreated control cells. (D) Phospho-H3 was detected as described in Fig 2. Each value in (C) and (D) represents the mean (+/- SEM) determined from 3 independent experiments. In (C), the mean values for both cell lines at 10 and 25 nM PB were significantly different from 1 by single sample T test (P < 0.05). In (D), ** indicates that the values were significantly different (P<0.01) by Student T test.

