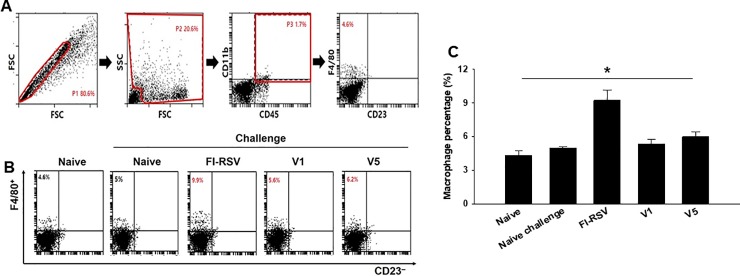
Fig 7. Macrophage response in the lung observed by cell phenotyping.
To understand the macrophage populations in the lung, cells from the lung (n = 6) were isolated and stained with surface markers. Macrophage phenotype gated on F4/80+CD23– in CD45+CD11b+ total cells was observed (Fig 7A, 7B and 7C, *P < 0.05). Fig 7A showed the gating strategy for the plots. V1 and V5 VLPs showed similar levels of macrophage infiltration to naïve or naïve challenge control upon RSV A2 challenge infection. The data shown are representative of three independent experiments.

