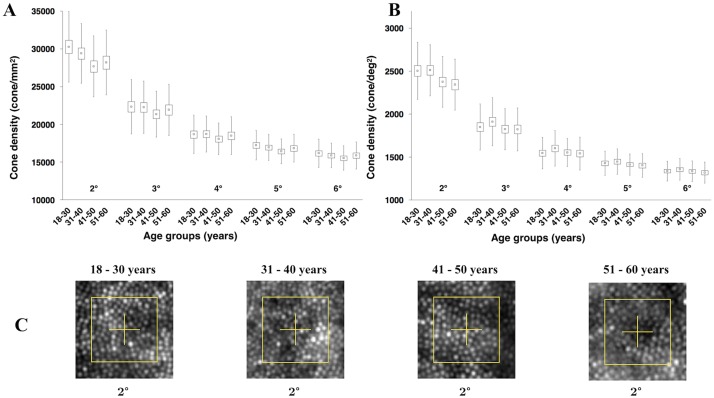
Fig 3. Cone density as a function of age and eccentricity.
(A) Results expressed in metric units and (B) in visual units. (C) Images of ROI (yellow square) analysed at 2° of eccentricity for one subject representative of each age group. Yellow squares represent area of the retina when expressed in visual unit (i.e., 80 pixels or around 13 minutes of arc). We can observe a difference of cone density between the two first groups (i.e., between 18 and 40 years old) and the two last groups (i.e., between 41 and 60 years old).

