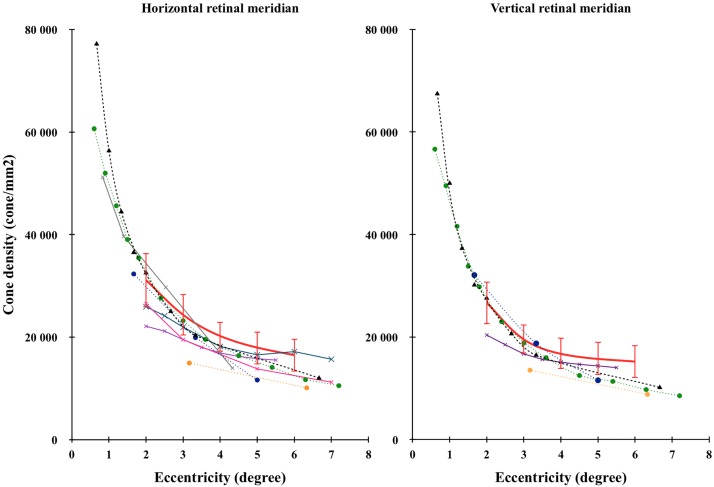
Fig 5. Comparison of cone density as a function of eccentricity with the literature.
Horizontal (left) and vertical (right) retinal meridians were compared with the literature. Error bars represent the interval of confidence (± 2SD). The red curve represents our data (rtx1, 109 retinas), the black dashed curve with triangles represents Curcio’s data (histology, 8 retinas) [2], the orange dashed curve with circles represents Chui’s data (AOSLO, 11 retinas) [5], the green dashed curve with circles represents Song’s data (AOSLO, 20 retinas) [7], the blue dashed curve with circles represents Park’s data (AOSLO, 192 retinas) [8], the grey curve with crosses represents Lombardo’s data (rtx1, 20 retinas) [13], the pink curve with crosses represents Muthiah’s data (rtx1, 3 retinas) [17], the purple curve with crosses represents Feng’s data (rtx1, 35 retinas) [20] and the blue curve with crosses represents Jacob’s data (rtx1, 28 retinas) [22].

