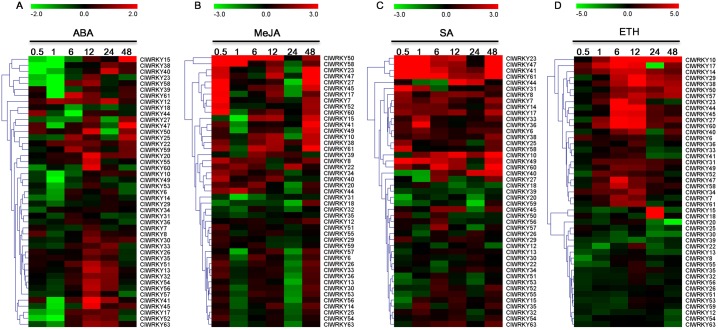
Fig 9. Expression patterns of ClWRKY genes under exogenous hormone treatments.
Scale bars on the top of each heat map represent log2-transformed (Treatment/Control) values. The hormone treatments including abscisic acid (ABA), methyl jasmonic acid (MeJA), salicylic acid (SA) and ethephon (ETH) are shown as heatmaps (A), (B), (C) and (D), respectively. 0.5, 1, 6, 12, 24 and 48 indicate hours after treatment.

