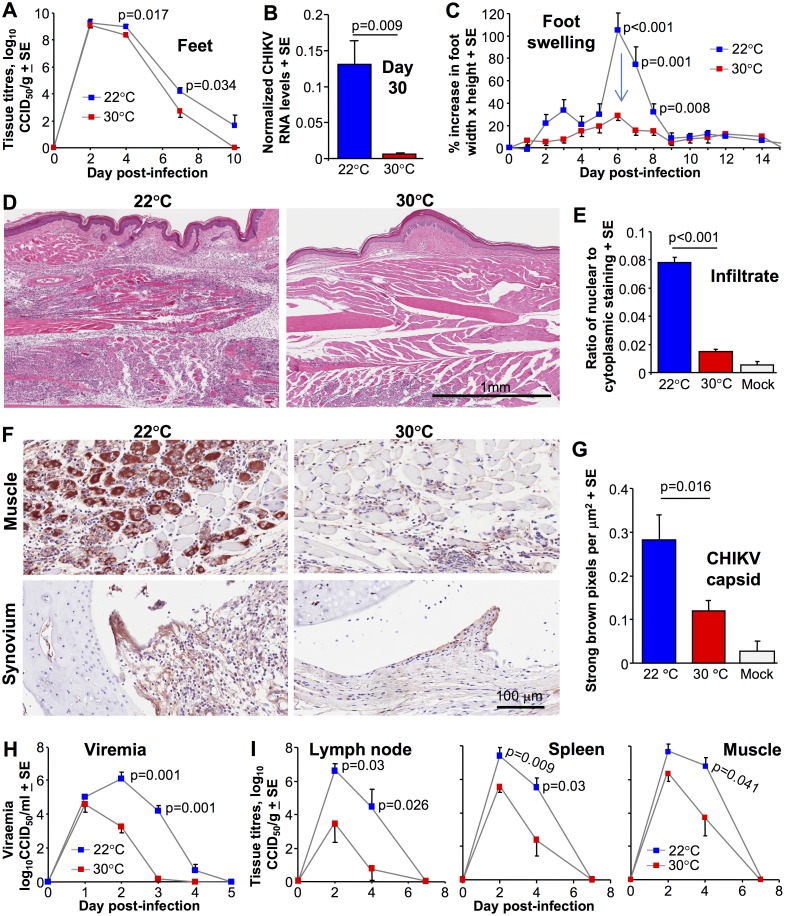
Fig 1. The effect of ambient temperature on CHIKV infection and disease.
(A) CHIKV titers in feet of mice held at 30°C or 22°C after CHIKV inoculation s.c. into the feet. (Statistics by t test, day 4 or Kolmogorov-Smirnov test, day 7, n = 12/16 feet from 6/8 mice per group, data was obtained from two independent experiments). (B) Relative CHIKV RNA levels in feet on day 30 post infection. RNA levels normalized to RPL13A. (Statistics by Kolmogorov-Smirnov test, n = 6 feet from 6 mice per group). (C) Foot swelling for mice housed at 30°C or 22°C (Statistics by Kolmogorov-Smirnov or Mann-Whitney U tests, n = 12–16 feet from 6–8 mice per group, data was obtained from two independent experiments). (D) Examples of H&E staining of arthritic feet day 7 post infection for mice housed at 22°C and 30°C. At 22°C blue staining nuclei of infiltrating cells can be seen throughout the section. At 30°C blue staining nuclei of infiltrating cells are less abundant, with a patch evident bottom middle/left of the section. (E) Aperio pixel count quantification of the leukocyte infiltrates (exemplified in D), expressed as a ratio of nuclear to cytoplasmic staining ratios; (infiltrating leucocytes have relatively high nucleus to cytoplasm ratios [36]). N = 6 mice and feet per group, with 3 sections per foot used to produce a mean for each animal; statistics by t test. (F) Immunohistochemistry of muscle and synovial tissues (using an anti-CHIKV capsid monoclonal antibody) on day 7 post infection in feet of mice held at 22°C and 30°C. Staining of mock infected controls is shown in S1B Fig. (G) Aperio pixel count quantization of the immunohistochemistry (n = 5/6 feet from 5/6 mice for each temperature), with three sections per foot providing a mean for each foot. Statistics by Mann Whitney U test. (H) Viremia of mice housed at an ambient temperature of 30°C or 22°C and infected s.c. in the feet. (Statistics by Mann-Whitney U tests, n = 6–8 mice per group). (I) CHIKV titers in inguinal lymph nodes (two from each mouse pooled), spleen and quadriceps muscle (two from each mouse pooled) of mice held at 30°C or 22°C. (Statistics by Mann-Whitney U test, t test or Kolmogorov-Smirnov tests, n = 6–8 mice per group, data was obtained from two independent experiments).

