
Figure 1.
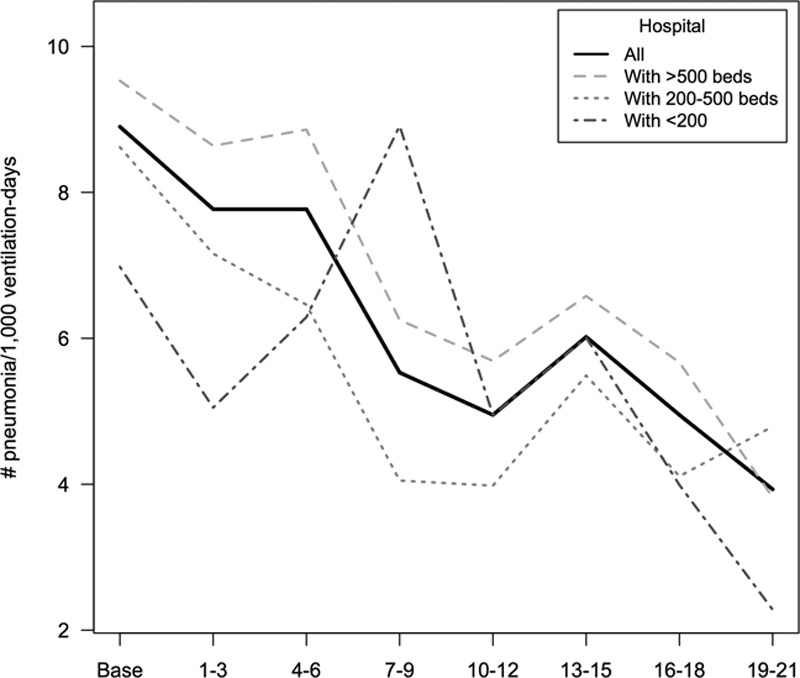
Changes of rates for ventilator-associated pneumonia for each time period of participation in the “Pneumonia Zero” project according to characteristics of the hospital (individual values of each curve are shown in Table 5-e, Supplemental Digital Content 1, http://links.lww.com/CCM/C886).