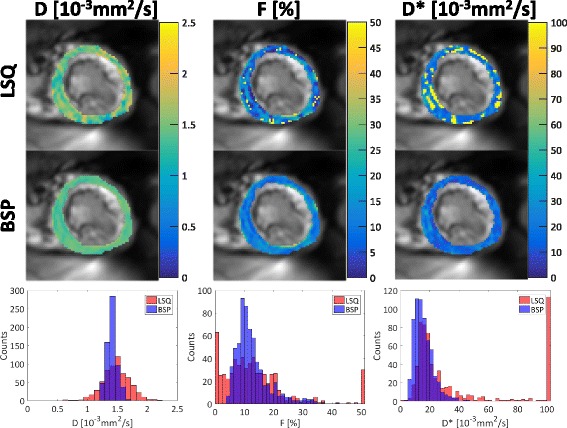
Fig. 5.

IVIM parameter maps with corresponding histograms. Spatial variation of the parameters is reduced for the Bayesian approach (BSP) relative to least-squares (LSQ). Histograms show corresponding narrower distributions for BSP versus LSQ. Note that local variations in F are preserved with the BSP method. Outliers are greatly reduced with BSP for F and D ∗
