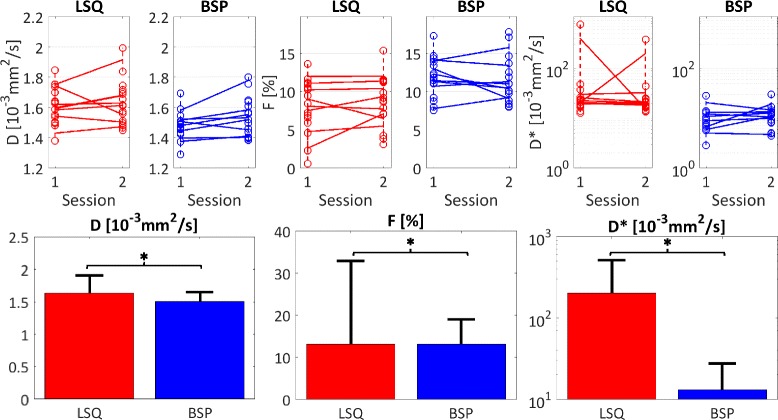
Fig. 8.

Summary. Top row: medians across the regions-of-interest for the two sessions and scans (connected by dashed lines). The means of the medians of the two intra-session repetitions are connected by solid lines for the two sessions. The BSP estimates are clustered closer together and cover a smaller range compared to the LSQ derived estimates. Bottom row: means and standard deviations of all estimates across all volunteers and repetitions. The standard deviations are consistently smaller for BSP. The parameter estimates of the two methods are significantly different (*, p < 0.05). Note the logarithmic y-axes for D ∗
