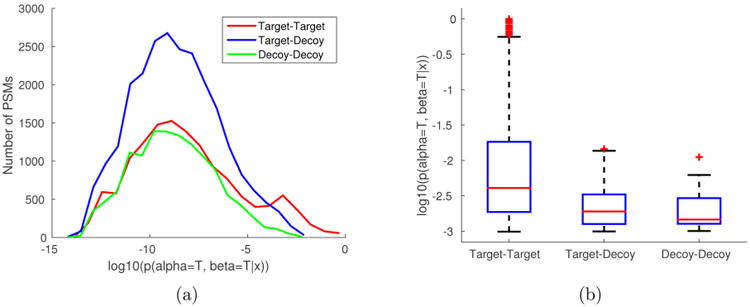
Figure 2.

Score distribution of the PSMs that result from database searching against the target-decoy database of E. coli ribosomal proteins. (a) The histogram of the joint probability scores of PSMs where (1) both peptides are in the target database (target–target), (2) one peptide is in the target and the other is in the decoy database (target–decoy), and (3) both peptides are in the decoy database (decoy–decoy). (b) The box plot of top-thousand PSMs divided into three groups: target–target (794), target–decoy (162), and decoy–decoy (44). The averages are 5.59·10−2, 2.76·10−3, and 2.42·10−3, respectively.
