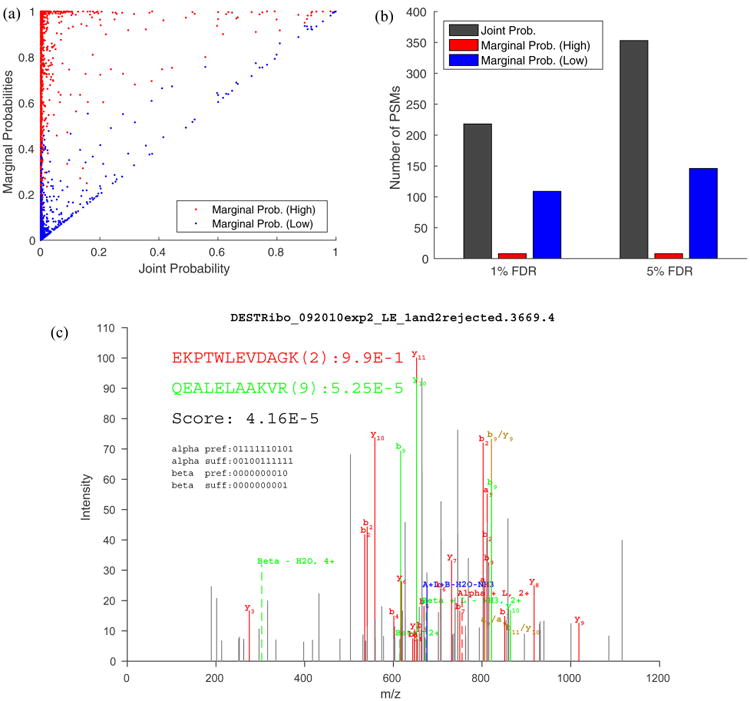
Figure 3.

Marginal probabilities estimated for each individual peptide in a PSM. (a) Scatter plot of the higher (red) and lower (blue) marginal probability versus the corresponding joint probability for each PSM. The Pearson correlation coefficient between the marginal probabilities and the joint probabilities are 0.237 (red) and 0.882 (blue), respectively. (b) The numbers of cross-link PSMs identified at the PSM-level FDR using the target–decoy approach. The score associated with each PSMs equals (1) the joint probability of the PSM (gray), (2) higher marginal probability (red), and (3) lower marginal probability (blue). Notice that the lower marginal probability resulted in more identifications than the higher one, and the joint probability is superior to either marginal probability. (c) The spectrum identified as a correct (red) peptide cross-linked with an incorrect (green) peptide with marginal probabilities of 0.99 and 5.25·10−5, respectively. The peptide depicted in red is from the forward sequence of S4 of the small subunit of the E. coli ribosome and is extensively covered by fragment ion assignment. The peptide depicted in green is from the reversed sequence of S4 and has only two fragment ion assignments. The decoy peptide (in green) has the same amino acid composition as the true peptide (i.e., VKAALELAEQR).
