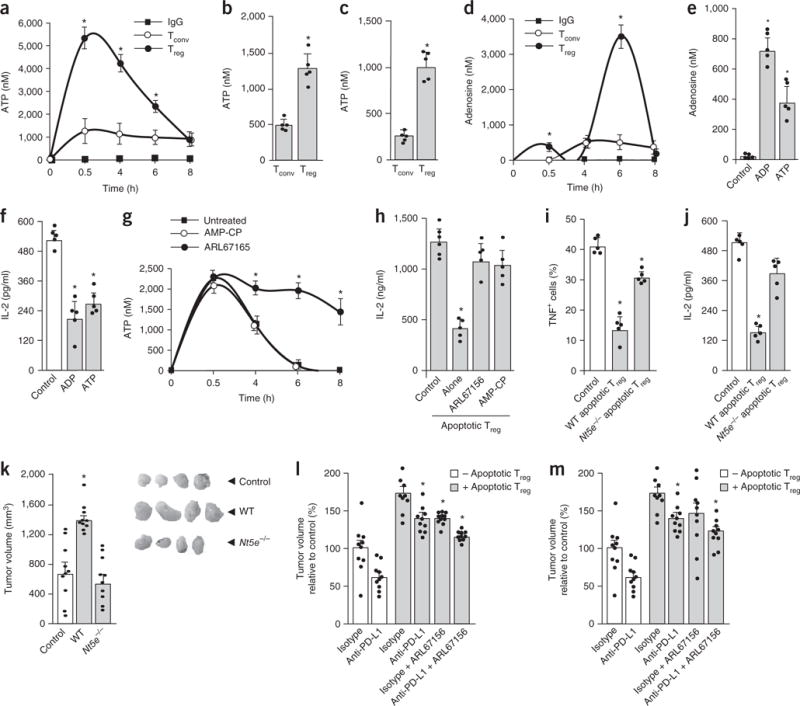
Figure 5.

Apoptotic Treg cells release ATP and generate high levels of adenosine. (a) Kinetics of ATP release by apoptotic Treg cells. Mouse Treg cells and conventional T cells (Tconv) were treated with anti-Fas mAb or isotype IgG. ATP in the supernatant was measured by colorimetric assay. Mean ± s.d., n = 6. *P < 0.05, Student’s t-test between Treg cells and conventional T cells at each time point. (b,c) ATP released by mouse apoptotic Treg cells under serum starvation (b) or after irradiation (c) in the presence of ectonuclease inhibitor ARL67156. The ATP concentration in apoptotic Treg supernatants was measured at 16 h. Mean and s.d., n = 5. *P < 0.05, Student’s t-test. (d) Kinetics of adenosine generation by apoptotic Treg cells. Mouse Treg cells and conventional T cells were treated with anti-Fas mAb or isotype IgG in the presence of the adenosine deaminase inhibitor EHNA. Adenosine was measured in the supernatant. Mean ± s.d., n = 6. *P < 0.05, Student’s t-test between Treg cells and conventional T cells at each time point. (e,f) Adenosine generated from exogenous ADP and ATP by apoptotic Treg cells. Exogenous ADP or ATP (5 μM) was added to fresh medium with apoptotic Treg cells for 6 h. Adenosine was measured in the culture supernatants (e). Supernatants were used for immunosuppression assays (f). Mean and s.d., n = 5. *P < 0.05 versus control, Wilcoxon test. (g) The effect of ARL67165 or AMP-CP on ATP release by apoptotic Treg cells. Mouse Treg cells were treated for 8 h with anti-Fas mAb with or without ARL67165 or AMP-CP. ATP was measured in the supernatants. Mean ± s.d., n = 5. *P < 0.05 versus the untreated control, Wilcoxon test. (h) The effect of ARL67165 or AMP-CP on apoptotic Treg cell–mediated immunosuppression. Mouse Treg cells were cultured for 8 h with anti-Fas mAb with or without ARL67165 or AMP-CP. The culture supernatants were used for T cell immunosuppression. IL-2 was measured on day 3 by ELISA. Mean and s.d., n = 8. *P < 0.05 versus control, ANOVA with Dunett’s post-test. (i,j) Immunosuppression mediated by wild-type (WT) and Nt5e−/− apoptotic Treg cells. Apoptotic Treg cells from wild-type and Nt5e−/− mice were used for T cell immunosuppressive assays. TNF expression was measured by flow cytometry (i), and IL-2 was detected by ELISA (j). Mean and s.d., n = 5. *P < 0.05 versus control, Wilcoxon test. (k) The effect of Nt5e−/− apoptotic Treg cells on tumor growth in vivo. MC38 tumors were inoculated subcutaneously with wild-type or Nt5e−/− apoptotic Treg cells. The images show representative tumors at the endpoint of the experiment. Mean and s.e.m., n = 10. Student’s t-test, *P < 0.05 versus control. (l,m) The effects of CD39 and A2A inhibitors on tumor growth. MC38-bearing mice were treated with the CD39 inhibitor ARL67165 (5 mg/kg, 5 d per week) or the A2A inhibitor ZM241385 (1 mg/kg, 5 d per week) with anti-PD-L1 in the presence of apoptotic Treg cells. Mean and s.e.m., n = 10. *P < 0.05 compared with isotype control in the presence of the apoptotic Treg cell group, ANOVA with Dunnett’s post hoc test. All data in a–j were generated in single experiments; n values for those panels indicate the number of animals used for cell isolation. Data in k–m are from 1 experiment with 10 animals per group.
