Figure 6.

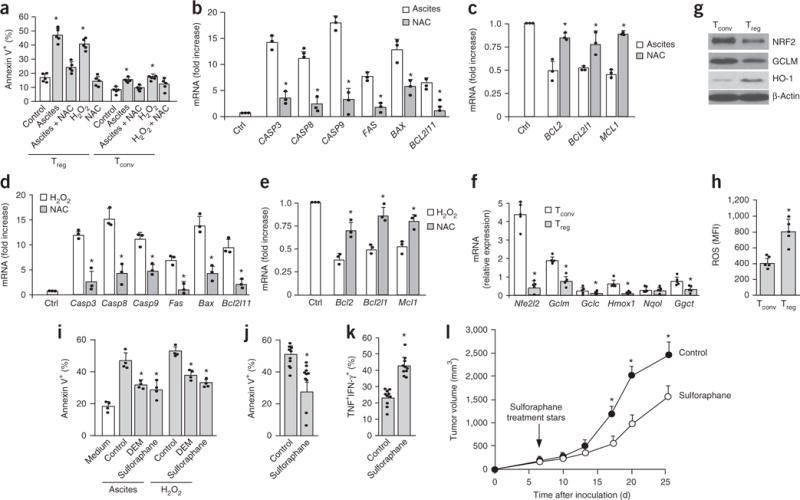
Oxidative stress induces Treg cell apoptosis in the tumor environment. (a) The effect of ovarian cancer ascites on human Treg cell apoptosis. Mouse Treg cells and conventional T cells (Tconv) were cocultured with 50% human ovarian cancer ascites or hydrogen peroxide for 24 h. Additional cultures were treated with N-acetyl-cysteine (NAC) as a free radical scavenger. Annexin V+ Treg cells and Tconv cells were analyzed by flow cytometry. n = 5. (b,c) The effect of ovarian cancer ascites on proapoptotic and antiapoptotic gene transcripts in Treg cells. Treg cells were exposed to ascites or ascites plus NAC after 24 h. Proapoptotic (b) and antiapoptotic (c) transcripts were quantified by real-time PCR. n = 3. (d,e) The effect of hydrogen peroxide on proapoptotic and antiapoptotic transcripts in Treg cells. Treg cells were exposed to hydrogen peroxide or hydrogen peroxide plus NAC after 24 h. Proapoptotic (d) and antiapoptotic (e) mouse gene transcripts were quantified by real-time PCR. n = 3. (f,g) Expression of mouse NRF2 and NRF2-associated gene transcripts (f) and proteins (g) in T cell subsets as determined by real-time PCR and immunoblotting, respectively. n = 5. (h) The expression of intracellular ROS in Treg cells. Treg cells and conventional T cells were cultured overnight. Amounts of intracellular ROS were measured by flow cytometry. n = 5. MFI, mean fluorescence intensity. (i) The effect of NRF2 inducers on Treg cell apoptosis in vitro. Mouse Treg cells were cultured for 24 h with 50% ascites or medium containing H2O2. NRF2 inducers diethylmaleate (DEM; 100 μM) and sulforaphane (10 μM) were added to the culture for 24 h. Controls were treated with vehicle (DMSO). Apoptosis was measured by flow cytometry with annexin V. n = 4. (j–l) The effect of sulforaphane on tumor immunity. MC38-bearing mice were treated with sulforaphane (25 mg/kg, 5 d per week) or vehicle (DMSO). Tumor Treg cell apoptosis (j) and CD8+ T cell polyfunctional cytokine expression (k) were analyzed by flow cytometry. Tumor volume was monitored (l). n = 10. All data are shown as the mean and s.d. and are from 1 experiment with 10 animals per group (i–l) or from single experiments with cells isolated from individual animal for each data point (a–h). *P < 0.05 versus control, Wilcoxon test (b–e), paired Student’s t-test (f,g), Student’s t-test (i–l), or Mann–Whitney U-test (a,h).
