. 2018 Jan 16;7:e31706. doi: 10.7554/eLife.31706

Figure 3. ISL1 KO phenocopies an atrial wild-type CM phenotype induced by retinoic acid.

(A) Upon directed cardiac induction, ISL1 KO as well as RA-treated wild-type hESCs display delayed terminal CM differentiation reflected by a later initiation of spontaneous beating (semiquantitiative analysis, n = 3–14 per sample). ‘ISL1’ and ‘no RA’ denote different batches of WT HuES6 cells. (B) Immunofluorescence analysis of the early CM marker myosin heavy chain 6 upon directed cardiac differentiation of the indicated samples/cell lines. ‘ISL1’ cells are d 3/4 transgene-induced ISL1 KO hESCs. (C) Expression pattern of atrial and ventricular-enriched genes in the indicated in vivo and hESC-derived samples. Primary human heart samples served as specificity controls (microarray data). (D) Confirmation of ventricular and atrial-specific gene expression profiles by RT-qPCR in independent sets of experiments (n = 4–7 per sample type). (E) Immunoblots 3 wk after the initiation of cardiac differentiation for ventricular-specific myosin light chain and atrial natriuretic peptide. (F) Confirmation of cardiac subtype-specific phenotypes by immunostaining (~3 wk time point). (G) Model summarizing the opposing roles of ISL1 and RA signaling in cardiac subtype specification. (H) Enhanced atrial and further reduced ventricular gene expression in RA-treated ISL1 KO CMs as compared to RA-treated WT and untreated ISL1 KO cells (RT-qPCR data at ~2.5 wk, n = 3). (I) Spontaneous beating analysis of the indicated hESC-CM samples on multielectrode arrays. Left: Representative traces. Right: Beating rate quantification (ntech. = 3). Results were reproducible in independent experiments. (J) Representative action potential traces from patch clamp analyses of the indicated types of hESC-CMs. Note the additional action potential shortening upon combining ISL1 depletion with RA treatment. See Supplementary file 2 for averaged data from independent samples. In case of using ISL1KO/I.TET-ON cells, all ISL1+ data in this figure are based on a day 3–4 treatment with DOX.

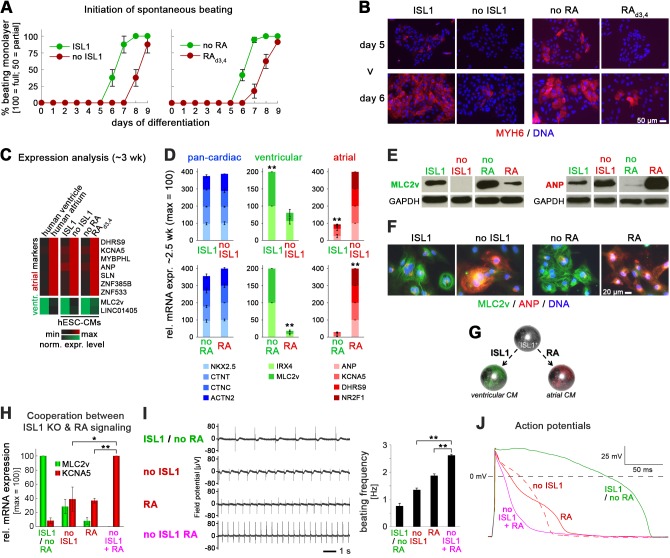
Figure 3.

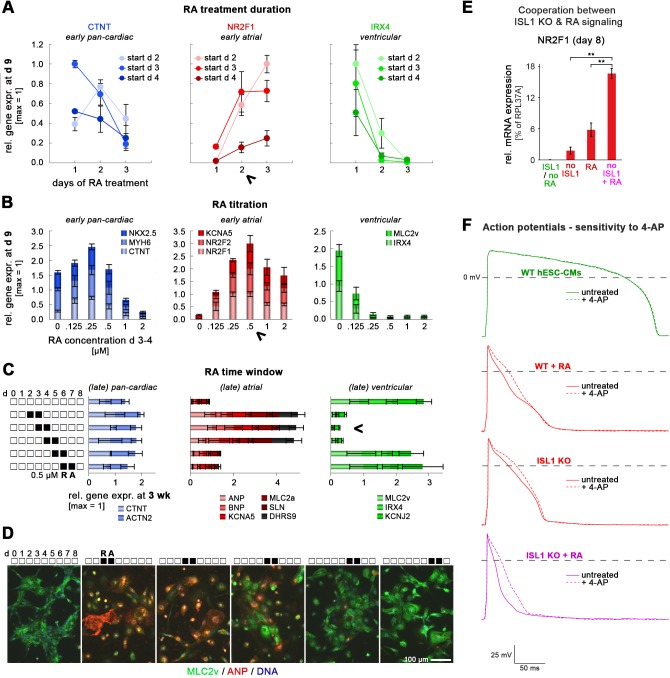
Figure 3—figure supplement 1. Atrial specification promoted by RA stimulation or ISL1 knockout.

Figure 3—figure supplement 1.

Panels A-C comprise optimization experiments to elucidate experimental conditions for atrial CM induction as the expense of a ventricular fate. (A) Optimization of RA treatment duration during cardiac induction of WT hESCs (qPCR data, n = 3). Arrow head indicates that a 2-day treatment was most optimal, since it promoted atrial marker induction at the expense of ventricular-specific gene expression while not yet compromising overall cardiac differentiation (compare to data in left chart). (B) Optimization of RA concentration for promoting an atrial CM fate. Differentiating WT hESCs were RA-treated on days 3 and 4. Arrow head indicates most optimal concentration at which (i) pan-cardiac differentiation was not yet compromised (left chart), (ii) atrial markers were maximally induced (middle chart), and (iii) ventricular genes became fully repressed (right chart). Data are from three independent experiments. (C) Elucidation of the RA-responsive time window during cardiac induction for promoting an atrial cell fate in the long-term (n = 3–6 per data point). Cells were treated during the first week of differentiation as indicated and analyzed after ~3 weeks. Arrow head indicates most reliable time window for exposure to RA (0.5 µM). (D) RA sliding window experiment analyzed via immunocytochemistry 4 weeks after differentiation start. (E) Enhanced expression of the atrial inducer NR2F1 in RA-treated ISL1 KO CMs as compared to RA-treated WT and untreated ISL1 KO cells (RT-qPCR data at day 8, n = 3–12). (F) Pharmacological inhibition of the atrial-specific ion channel KCNA5 discriminates ISL1 KO cardiomyocytes from WT ones in a functional manner. Data shows representative action potential traces before and after 4-AP treatment to block KCNA5. Also see Supplementary file 2B for averaged data from various patched cells. Note that only WT hESC-CMs were insensitive to 4-AP, reflecting an overall ventricular identity. ISL1 KO CMs exposed to RA (0.5 µM on days 3 and 4) during cardiac induction show an enhanced atrial phenotype compared to WT + RA and RA-untreated ISL1 KO CMs, which is characterized by decreased AP durations and an enhanced relative AP duration increase by 4-AP (bottom panel, Supplementary file 2).