
Fig. 1. Crystal structure of FGT.
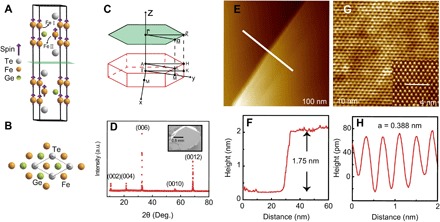
(A) Side and (B) top views of the crystal structure of FGT. Inequivalent Fe sites are labeled as I and II, respectively. The most possible cleaving plane parallel to the (001) surface is shown in green. (C) The bulk and projected Brillouin zones of FGT. (D) XRD pattern for the as-grown facet of FGT single crystals, with (001) diffraction peaks observed exclusively. The insert is an image of FGT compound revealed by scanning electron microscopy. a.u., arbitrary units. (E) STM step and (G) atomic resolution images (0.3 V, 100 pA) on the cleaved (001) surface of FGT. (F) The step height and (H) nearest-neighbor atomic distance are measured from the profiles of the line sections in (E) and (G), respectively.