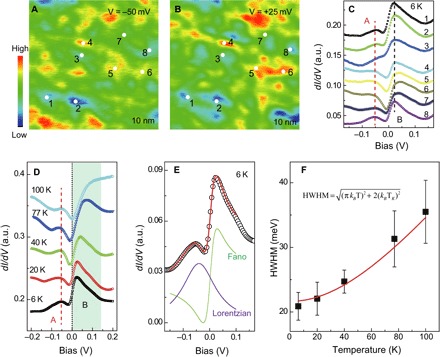
Fig. 4. Emergence of the Fano resonance peak at low temperature.

(A and B) dI/dV maps (200 pA) on the same field at 6 K with bias voltages of −50 and +25 mV, respectively. (C) Spatial-resolved low-energy dI/dV spectra measured at the eight locations marked in (A) and (B). Two peaks located at −50 meV (A) and +25 meV (B) are marked with dashed lines. (D) Spatially averaged dI/dV spectra taken at different temperatures. The two peaks are marked with the red dashed line and green shadow, respectively. (E) Theoretical simulation (red curve) of the experimental dI/dV spectrum (black dots) at 6 K. The simulated Fano feature (green curve) is subtracted from the raw data, and the remaining peak is fitted by a Lorentzian term (purple curve). The Fano and Lorentzian terms are shifted for clarity. (F) Temperature dependence of the Fano resonance width extracted from the fitting in (E). The red line represents the temperature dependence of the width for a single Kondo impurity.
