
Fig. 5. Coherent-incoherent crossover in the FM state.
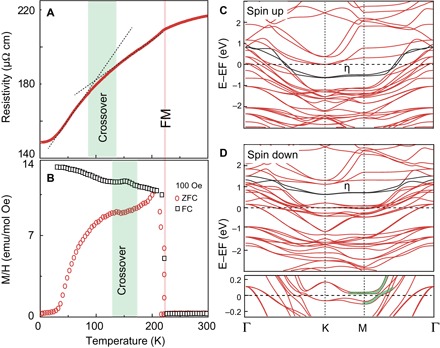
(A and B) Temperature dependence of resistivity and magnetic susceptibility for FGT. The dashed lines in (A) are two tentative T linear trends to extract the value of T*. The bold green and orange lines mark the crossover and PM-FM transition, respectively. (C) Spin-up and (D) Spin-down band structures of Te-terminated FGT. The black line is the experimentally observed flat band η in Figs. 2 and 3. The bold green lines in the lower panel in (D) represent the hybridization between strongly dispersive bands and weakly dispersive bands near EF.