
Fig. 4. Membrane voltage sensing of spiking HEK293 cells with pcNRs.
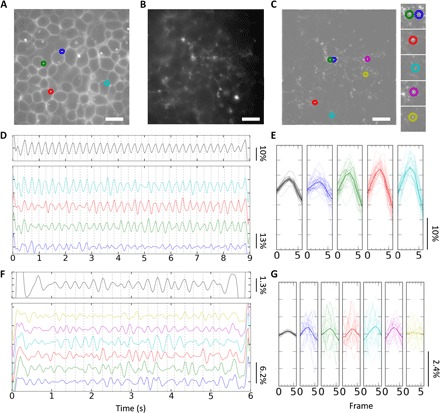
(A and B) Fluorescence images of cells stained with ANEPPS (A) and pcNRs (B). (C) Spatially high-pass–filtered image of (B) used to highlight signals from individual pcNRs and remove background signals. (D and F) Temporal bandpass-filtered ΔF/F time trace of ANEPPS (D, top) and pcNRs (F, top). Each trace (D and F, bottom) shares the same color as the marked open circles in (A) or (C), respectively (see section S8). (E and G) Overlaid ΔF/F’s of seven frames around the gray dashed lines in (D) and (F). (D) and (F) have 23 and 19 thin lines in each subplot, respectively. Mean traces are shown with thicker line width. The leftmost subplots with black lines are ΔF/F of ensemble average [generated from top in (D) and (F)]. Scale bars, 10 μm.