
Fig. 1. Experimental recordings of AP biomarkers show significant differences between SR and cAF.
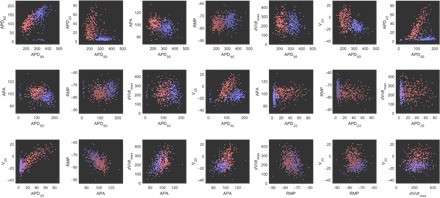
Pairwise scatterplots of each unique pair of biomarkers in the SR data set (blue) and the cAF data set (red). Clear differences in how biomarker values are distributed between the two populations are seen, especially for the APD biomarkers. Overall, the data exhibit a large amount of variability, highlighting the importance of characterizing this variability in understanding cardiac electrophysiology.