
Fig. 3. Selection of an optimal subpopulation almost fully captures biomarker variability.
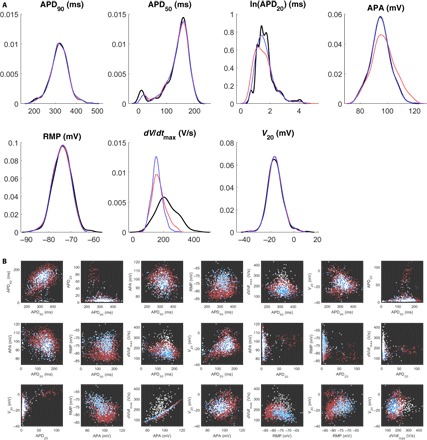
(A) Marginal distributions of the biomarkers in the SR data set (black) and POMs selected as subpopulations of the SMC-generated POM that minimized ρ (red) or (blue). The simulated annealing algorithm succeeds at selecting a representative subpopulation, but the distributions of the APA and dV/dtmax are not quite captured. De-emphasizing dV/dtmax in the calibration process provides very good capture of variability in all other biomarkers. (B) Pairwise scatterplots of each unique pair of biomarkers in the SR data set (white) and the models from the SMC-generated POM that were accepted (light blue) or rejected (dark red) in the process of minimizing . Outside of dV/dtmax, especially its relationship with APA, the features of the data are very well represented by the final POM.