
Fig. 8. Selection of parameter values using distribution-calibrated POMs produces updated models that correspond to provided data.
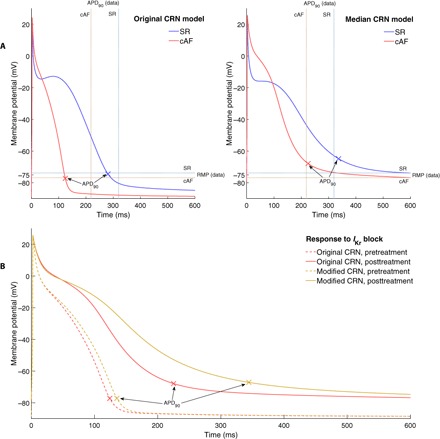
(A) AP curves for SR (blue) and cAF (red) as predicted by the original and median CRN model. Experimental calibration via POMs produces a model that fits very well the general trend of the data (mean values of biomarkers from the data indicated by dashed lines). (B) cAF APs before (red) and after (gold) treatment via IKr blocker for the original (dashed) and modified (solid) CRN model. Our median CRN model predicts the antiarrhythmic effects of IKr block (via APD prolongation), whereas the original CRN model predicts little response.