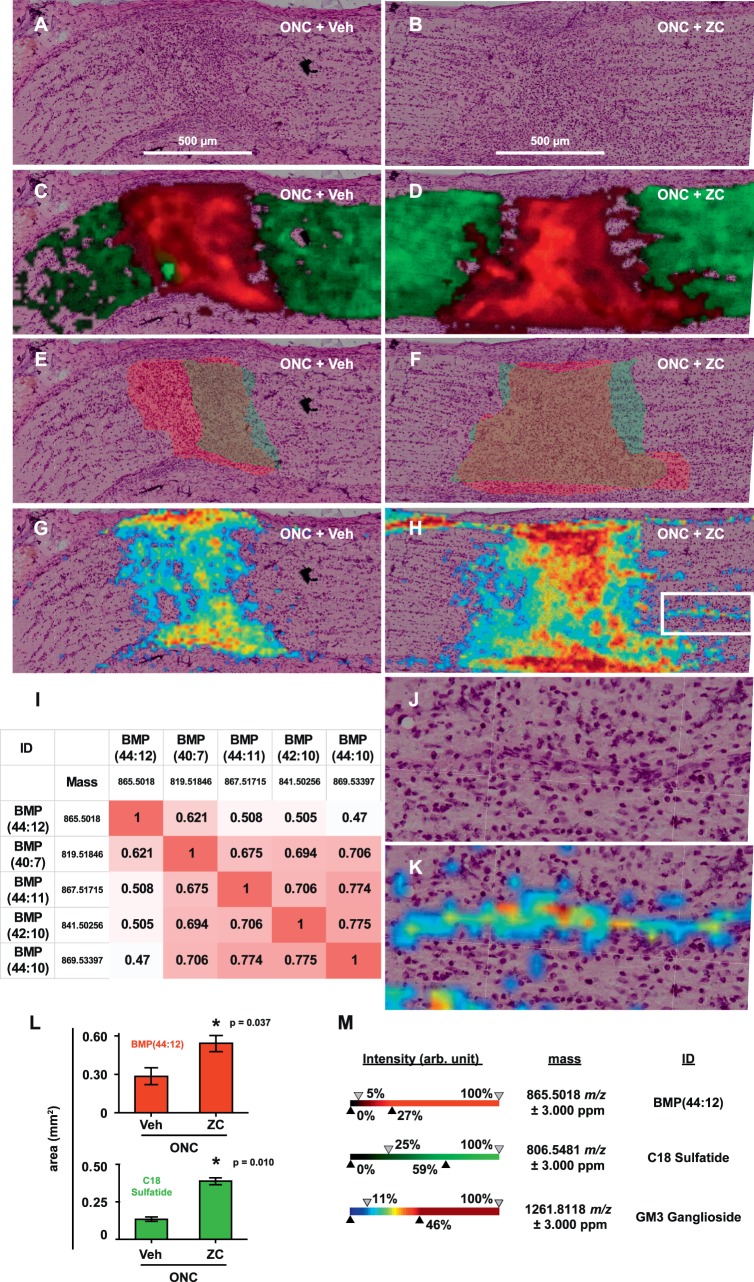
Figure 5.
IIR remodels the optic nerve lipidome. (A, B) Representative postacquisition H&E images of longitudinal sections from the ONC+Veh and ONC+ZC groups (day 7) without overlays. (C, D) Intensity map (m/z image) overlays for selected ions m/z 865.5018 (red) and 806.5481 (green). These were tentatively identified as BMP(44:12) and C18:0 sulfatide, respectively. (E, F) ROIs corresponding to the tissue area occupied by (or deficient of) m/z 865.5018 (red) and 806.5481 (green), respectively. (G, H) overlays of the m/z image for 1261.8118 (GM3 ganglioside). (I) Correlation matrix for m/z 865.5018. Highly correlated ions that matched 13C isotopes of the indicated BMP species were omitted for clarity. (J, K) Expanded views of the boxed area in H, with and without m/z image overlay for 1261.8118. (L) Summary of ROI area data for BMP(44:12) and C18 sulfatide. (M) Ion intensity scales for m/z images in C, D, G, H, and K.

