Fig. 1.

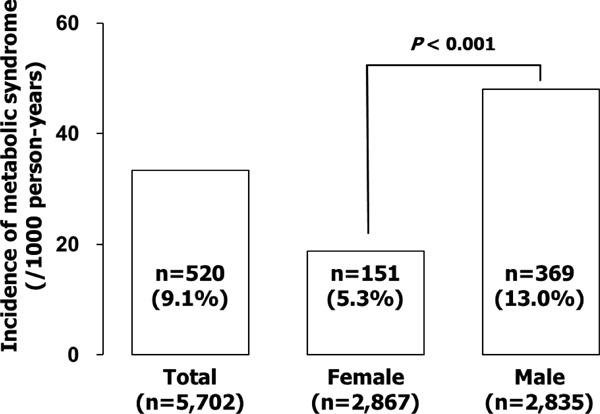
Development of metabolic syndrome during the observation period. Bar graphs show the incidence of metabolic syndrome in total, female, and male subjects. Note that the incidence was higher in males than in females.

Development of metabolic syndrome during the observation period. Bar graphs show the incidence of metabolic syndrome in total, female, and male subjects. Note that the incidence was higher in males than in females.