Figure 1.
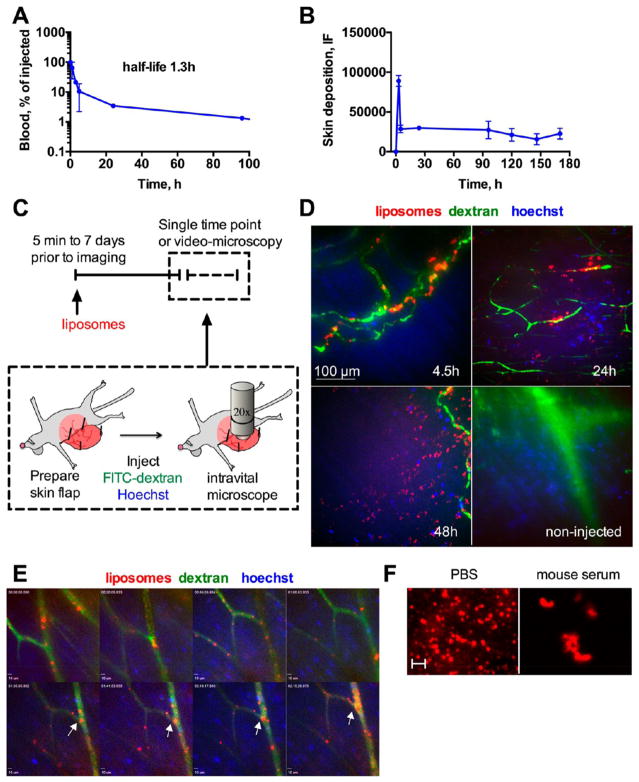
Dynamics of accumulation of non-PEGylated liposomes in mouse skin: Mice were injected with EPC/DiI or EPC/DiR liposomes. (A) Blood clearance profile (monoexponential curve fit) of liposomes after systemic injection (n = 2). (B) Skin NIR fluorescence monitored with fluorescence spectroscopy (FONIRS). The contribution of blood pool was subtracted as described in the Methods. Note that DiR fluorescence persisted after the liposomes had cleared from the blood (arrow). n = 3. (C) Schematic of intravital imaging experiments. Hoechst and FITC-dextran were used for intravital nuclear staining and blood vessels contrast, respectively. The imaging setup shows the abdominal skin flap and the objective facing the subdermis. (D) intravital images (maximum projections of z-stacks) of skin at different times postinjection. At 24 and 48 h, there was fluorescence accumulation outside blood vessels. Corresponding 3-D movies are provided as video 1 and video 2. Size bar is the same for all images. (E) Selected frames of a video taken as soon as 5 min postinjection for duration of 2 h 15 min (video 3). Arrows point to large fluorescent particles that start to build up in capillaries at approximately 1.5 h postinjection. All experiments were repeated at least two times. (F) Liposomes show aggregation in mouse serum in vitro and in blood in vivo (Figure S1), suggesting that circulating particles observed in (E) are likely liposomal aggregates. Scale bar = 2 μm.

