Figure 2.
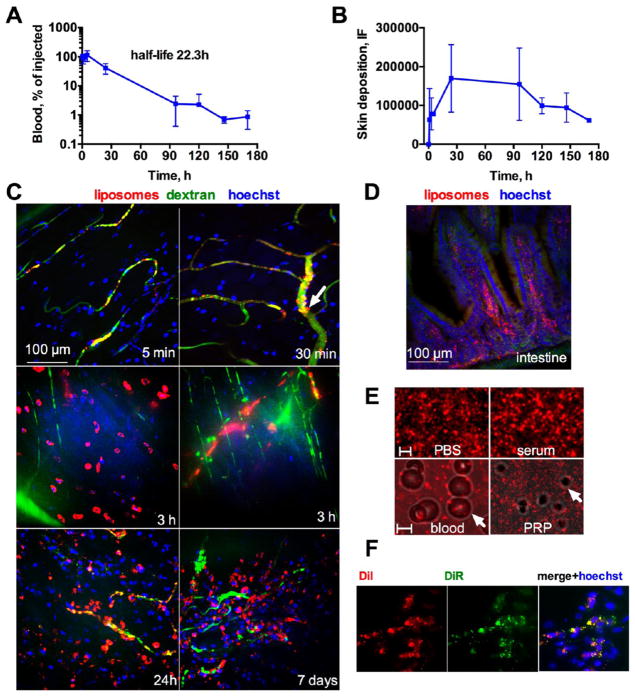
Dynamics of accumulation of PEGylated liposomes in mouse skin. Mice were injected with EPC/DSPE-PEG-2000/DiI or EPC/DSPE-PEG-2000/DiR liposomes. (A) Blood clearance profile (monoexponential curve fit) of liposomes after systemic injection shows long half-life of 22 h (n = 3). (B) Skin fluorescence with FONIRS shows slower buildup than non-PEGylated liposomes and prolonged retention after the liposomes had cleared from the blood (arrow); n = 3. (C) Intravital images (maximum projections of z-stacks) of skin at different times postinjection. Note the mostly intravascular deposition at early time points, some endothelial deposits (30 min, arrow) and massive extravasation of liposomes at later time points (3 h, 24 h and 7 days). Animated 3-D images are provided as video 4 and video 5. Size bar is the same for all images. (D) Histological section of small intestine (other organs are in Figure S2) at 7 days postinjection shows accumulation in microvilli. (E) Aggregation of liposomes was studied under fluorescent microscope. PEGylated liposomes do not show aggregates in serum in vitro and in vivo (whole blood and platelet rich plasma (PRP)). There was minimal binding to blood cells and platelets (Figure S3). Arrows point to RBC and platelet. Scale bar = 2 μm for the upper panel, 5 μm for the lower panel. (F) DiR and DiI fluorescence was mostly colocalized in the skin 24 h postinjection of DiI/DiR-labeled PEGylated liposomes, suggesting that liposomes arrived intact to the skin.

