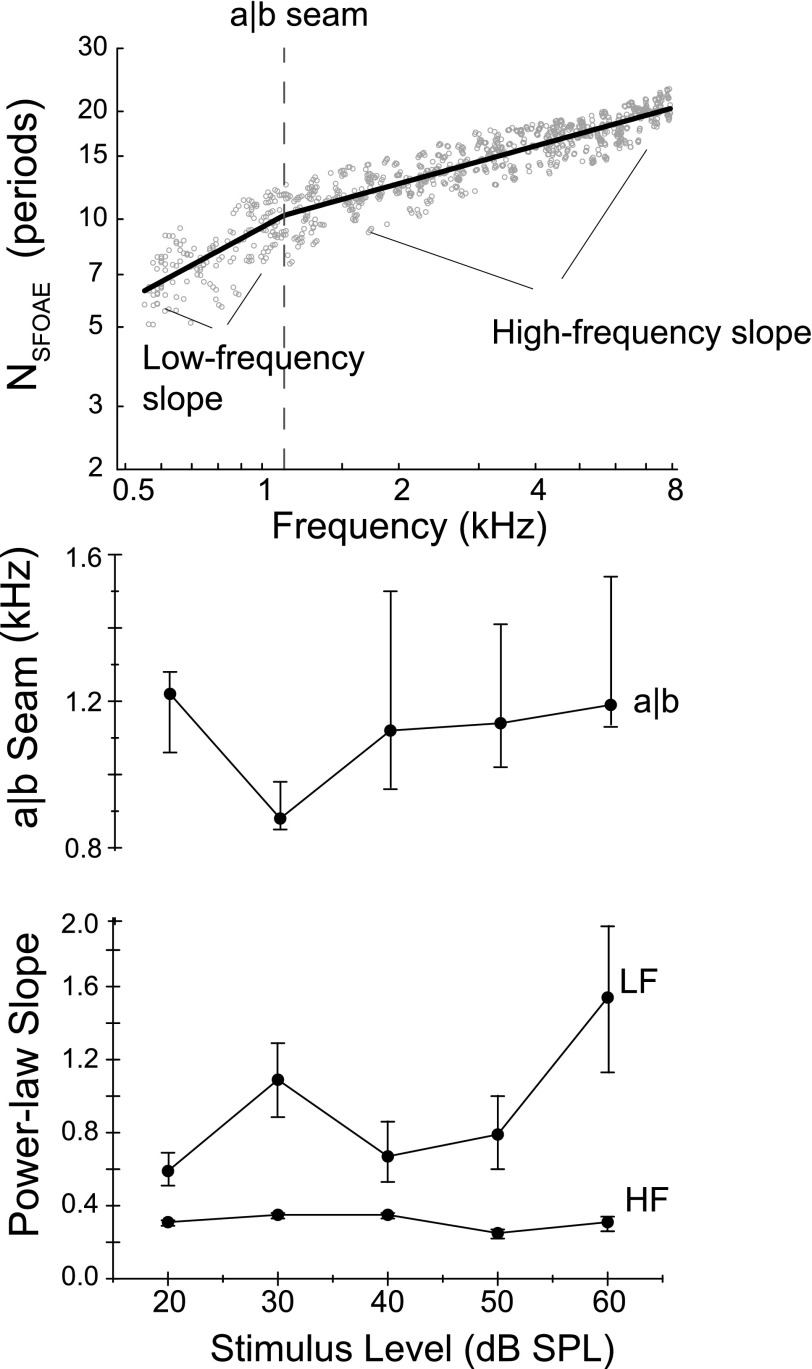
FIG. 8.
The top panel displays individual NSFOAE values across frequency at 40 dB SPL. The delays are fit with two intersecting power-laws (i.e., straight lines on log-log axes) where the point of intersection is a free parameter representing the frequency at which the slope of the SFOAE delay changes (e.g., the location of the putative apical-basal, a|b, transition). The group a|b transition was estimated, as were the power-law slopes of the NSFOAE function above and below this frequency. The bottom two panels show the group means for each of these parameters. The mean a|b seam was around 1.1 kHz for all probe levels. The low-frequency (LF) slope appears to steepen with increased stimulus level, while the high-frequency (HF) slope remains roughly invariant across level.

