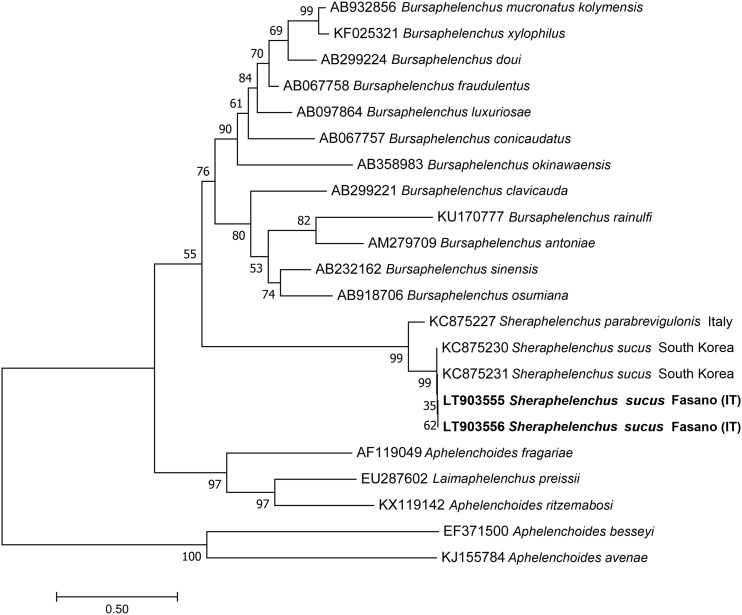
Fig. 3.
Phylogenetic tree based on ITS sequences describing the evolutionary relationships among different Sheraphelenchus and Bursaphelenchus species using the Maximum Likely (ML) method. Branch lengths are proportional to the distances as derived from the distance matrix obtained using the General Time Reversible (GTR) method with the invariant site plus gamma options. Numbers at nodes indicate bootstrap values.

