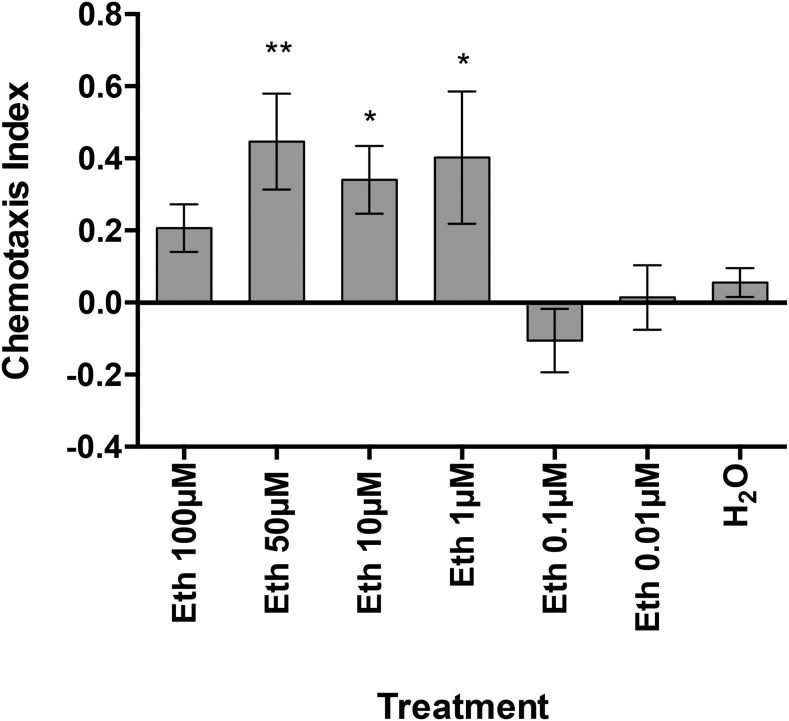
Fig. 4.
The chemotactic response of Meloidogyne incognita J2 to different ethephon (Eth) concentrations. Chemotaxis bioassays show attraction (positive index) or repulsion (negative index) values. Statistical analysis performed using one-way analysis of variance with Fisher’s LSD (P values: *P < 0.05; **P < 0.01) tests comparing with a H2O negative control; error bars represent SE.

