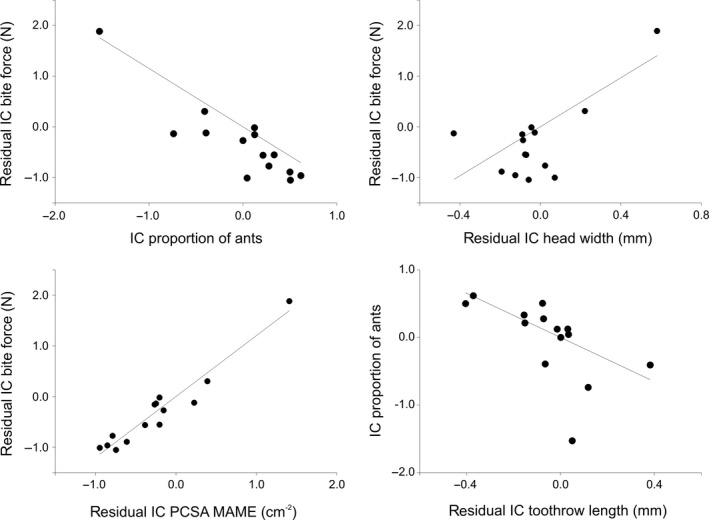
Figure 7.

Residual independent contrasts of bite force plotted against the residual independent contrasts of the proportion of ants in the diet, head width and the physiological cross‐sectional area of the external adductor. At the bottom right of the figure is a scatter plot illustrating the relationship between the independent contrasts of the proportion of ants in the diet and the residual independent contrasts of tooth row length. Note that all regressions are forced through the origin. (IC), independent contrasts.
