
Figure 3.
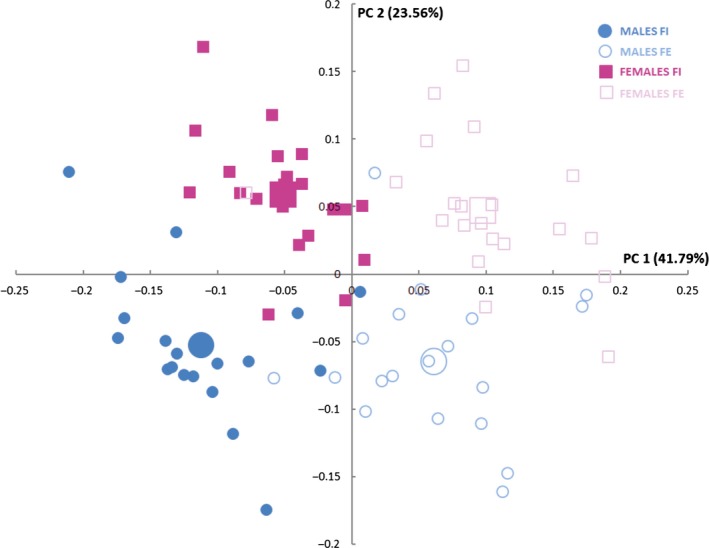
Scatterplot showing the relationship of the different subjects studied at principal component (PC)1–PC2. Females in forced inspiration (FI; pink filled squares), females in forced expiration (FE; pink unfilled squares), males in FI (blue filled circles) and males in FE (light unfilled circles). Larger squares and circles represent the mean of each group.