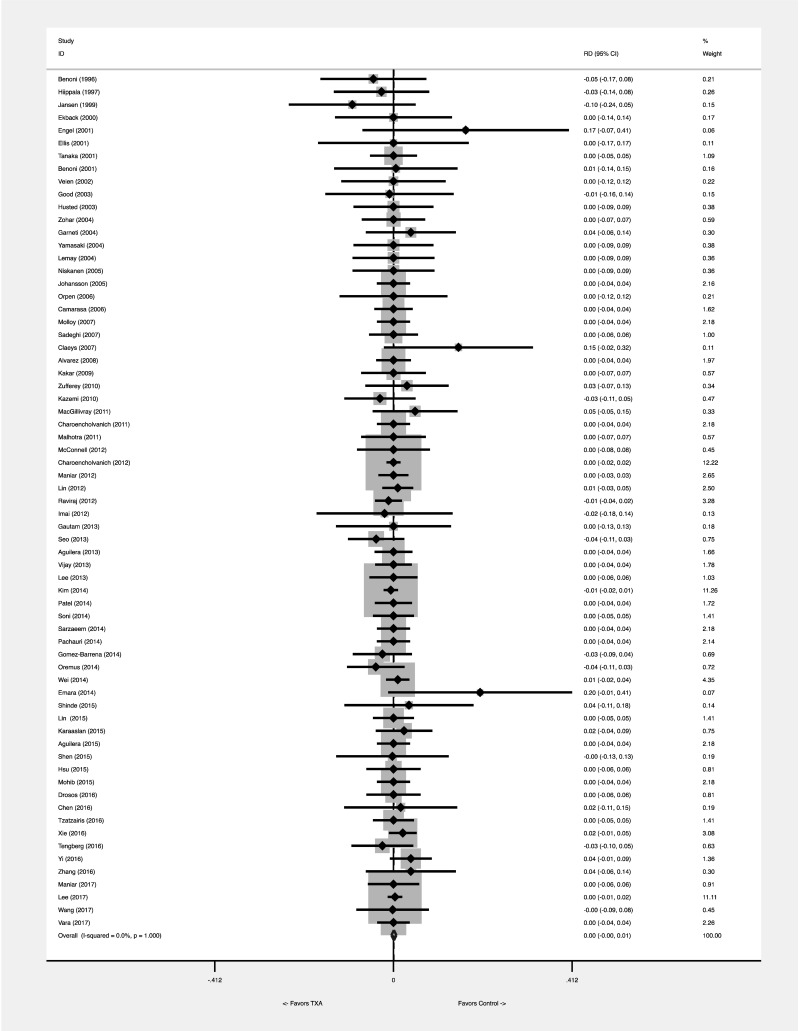
Figure 2A.
Effect of tranexamic acid on VTE risk: meta-analytical pooling. The effect was comparatively measured as risk difference (Figure 2A) and risk ratio (Figure 2B). Squares denote the risk difference and risk ratio, with their size being proportional to the weight assigned to the study. Horizontal bars indicate the 95% CI for each study. The diamonds represent the aggregate effect, with their width representing the 95% CI of the total effect.
CI: confidence interval; RD: risk difference; TXA: tranexamic acid; VTE: venous thromboembolism.

