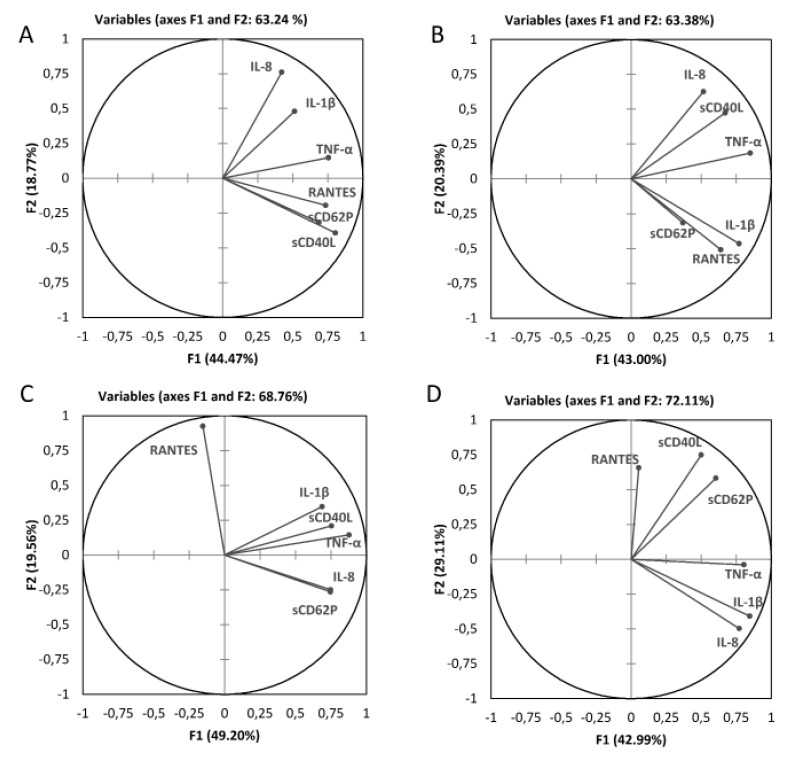
Figure 2.
A two-dimensional correlation monoplot of the coefficients of the first two principal components, showing relationships between the BRM during storage.
The correlation monoplot has vectors pointing away from the origin to represent the original variables. The angle between the vectors is an approximation of the correlation between the variables. A small angle indicates that the variables are positively correlated, an angle of 90 degrees indicates the variables are not correlated, and an angle close to 180 degrees indicates the variables are inversely correlated. The length of the line and its closeness to the circle indicate how well the variable is represented in the plot. A, B, C and D illustrate correlations at D0, D1+2, D3+4 and D5, respectively. D: day; TNF: tumour necrosis factor; RANTES: regulated on activation, normal T cell expressed and secreted; IL: interleukin.

