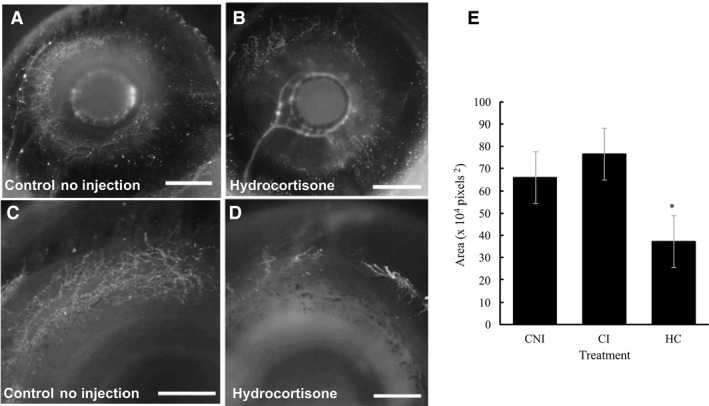
Figure 3.

Scleral vasculature at Hamburger and Hamilton (HH) 36 following hydrocortisone (HC) injection (high dose) compared with control embryos. Fluorescent images were converted to greyscale. (A and B) show the entire eye, while (C and D) show a close up of the dorsal group of condensations. (A, C) Control no injection (CNI) eyes; (B, D) reduced scleral vasculature following HC injection. (E) The average area of vasculature (divided by 104, in pixels2) for HC‐treated eyes compared with controls (CI). The sample numbers are CNI (n = 16), CI (n = 14) and HC (n = 16). The asterisk indicates that statistical significance between HC‐treated eyes and each of the control groups was found using two‐tailed t‐tests. Scale bars: 2 mm (A, B); 1 mm (C, D).
