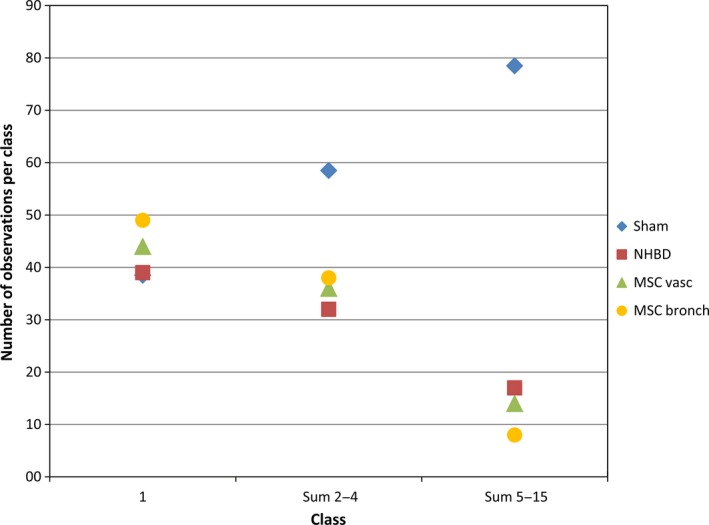
Figure 5.

Profile size distribution of lamellar bodies (lbs). Lb size was analysed using the point sampled intercepts method. For all sampled lbs, the profile intercept length was measured and assigned to one of 15 profile size classes. The group medians of observation numbers in class 1, sum of classes 2–4 and sum of classes 5–15 are depicted. Sum of classes 5–15 differed significantly between sham control group and all other groups (P = 0.031). Sham, sham control group; NHBD, non‐heart‐beating donor group; MSCvasc, pulmoarterial application of mesenchymal stem cells; MSCbronch, endobronchial application of mesenchymal stem cells.
